From the United States Census Bureau:
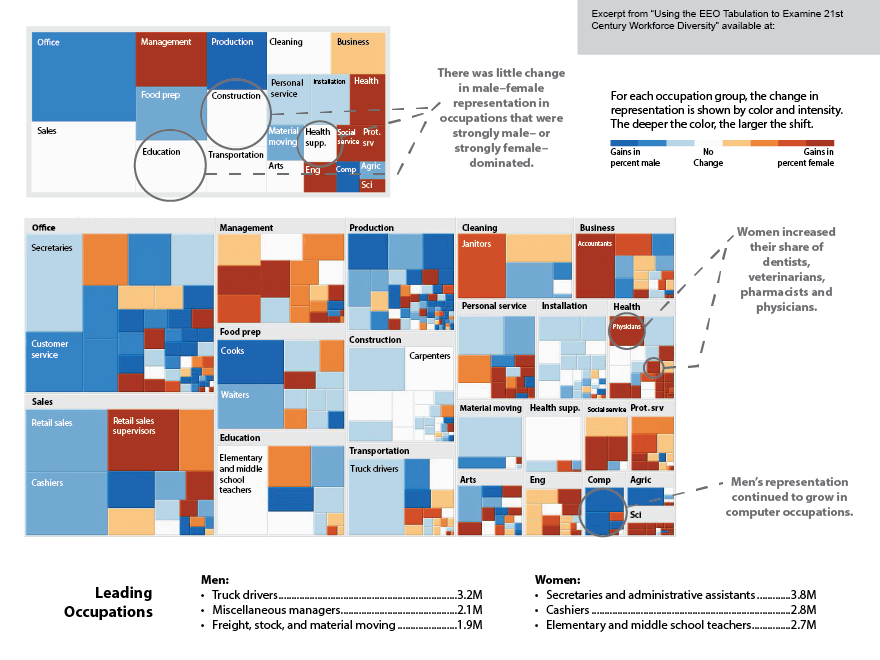
These two treemaps show change in
labor force representation (or share) of men and of women between two
time periods, while indicating the extent of this shift and the size of
the occupation group relative to other occupations. The smaller treemap
is for 22 occupation groupings, while the larger treemap is for more
than 500 occupations within those 22 groupings. The relative size of the
block signifies the size of the occupation; color shade and intensity
show the shift in gender representation, i.e., the deeper the color, the
larger the shift. Overall, men’s representation grew in computer
occupations and in some production occupations. We also see an increase
in women’s representation among many health care occupations, including
dentists, veterinarians, pharmacists, and physicians. Little changed
among occupations that were mostly male- or female-dominated, such as
construction workers and school teachers.This graphic represents a
portion of a larger poster that is available at
http://www.census.gov/people/io/publications/wp_posters.html.