Oil: "Is the US Refining Party Over?" (VLO; TSO; HFC; MPC; WNR)
From RBN energy Aug. 16:
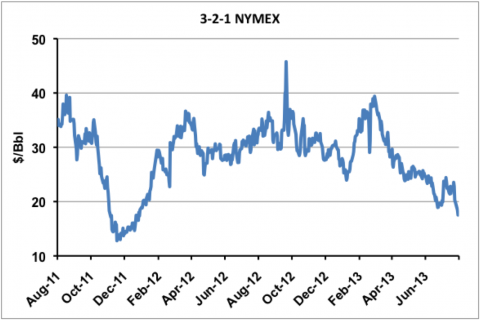
Last week (August 7, 2013) the 3-2-1 crack spread based on NYMEX CME
crude and refined product prices that is seen as a proxy for the
performance of US refinery margins, reached a two year low. The 3-2-1
crack has fallen 56 percent this year from its high in March. At the
same time refineries are still processing crude like there’s no tomorrow
– at over 90 percent of capacity. Can the party continue? Today we peak
through the cracks to uncover what’s going on.
What is a 3-2-1 Crack Spread?
To explain - the term “crack” does not refer to something a wayward
crude trader might ingest in the bathroom but rather to breaking down or
“cracking” crude oil. The term “spread” means the difference between
the sales price of the refined products and the raw material cost of
crude i.e. the refining margin. The 3-2-1 Crack spread approximates a
refinery that produces two barrels of gasoline and one barrel of diesel
for every three barrels of crude input. In other words the refinery
yield is two-thirds gasoline, one-third diesel (see Bakken Buck Starts Here Part IV).
In our case the 3-2-1 crack we are looking at is the NYMEX CME
futures market proxy for a refinery margin that is calculated using
nearby delivery contract prices for New York Harbor gasoline and diesel
(aka heating oil) and subtracting the cost of West Texas Intermediate
(WTI) crude. This is the most widely followed crack spread because it
roughly approximates the state of the US refining business. RBN Energy
keeps a running tally on the 3-2-1 crack - you can see that chart and
those of other important market indicators on our website. You get
access to more detail behind the charts if you are an RBN member (see About Spot check Indicators).
Falling Through The Cracks
The chart below shows the 3-2-1 crack spread over the past two years.
At the start of that period in August 2011, the WTI price was about a
year into its three-year period of heavy discount to the international
benchmark Brent crude (for chapter and verse on that saga see Strangers in the Night).
Because inland crude prices like WTI were low, and the price of refined
products in New York on the East Coast were based on higher
international crude costs, the 3-2-1 crack in August 2011 was hovering
around a very healthy $40/Bbl. Then the WTI discount to Brent narrowed
sharply in the fall of 2011 as the market believed that the first phase
of the Seaway pipeline reversal would miraculously solve the Midwest
crude logjam quickly and that inland crude prices could return to
coastal levels. That turned out not to be true once Seaway Phase 1
opened up in January 2012 and had little impact on the huge crude
stockpile in Cushing, OK. The WTI discount to Brent widened out again in
2012 and 3-2-1 crack values bounced back over $30/Bbl. And they stayed
at those levels until this year. The 3-2-1 crack peaked at $39.40 on
March 8, 2013 and ever since then has been on a downward trend –
reaching a low of $17.50/Bbl on August 7, 2013.
Why has the 3-2-1 crack spread fallen by 56
percent since March 2013? The chart below shows the components of the
spread in $/Bbl this year. The prices of diesel and gasoline (red and
blue lines respectively on the chart), the refined products in the crack
spread, basically tracked WTI crude prices (green line) through March.
During March and April product prices were higher when output from Gulf
Coast refineries that normally help meet demand on the East Coast was
reduced by refinery maintenance (see Turn Around).
That led to the near $40/Bbl 3-2-1 crack in early March. Ever since
then the crack spread has tanked and the chief culprit was a rapid
increase in WTI prices (brown dotted line on the chart). WTI prices
increased by nearly $20/Bbl between April and June and product prices
were flat over the same period. During this same period as WTI prices
increased, refiners increased their crude throughput rapidly – chasing
the higher margins....MORE
