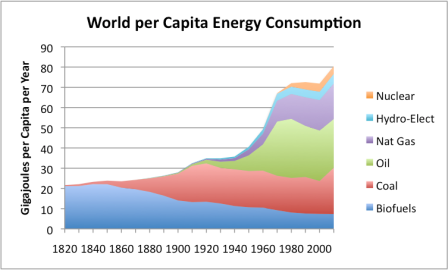
...With energy consumption rising as rapidly as shown in Figure 1, it is hard to see what is happening when viewed at the level of the individual. To get a different view, Figure 2 shows average consumption per person, using world population estimates by Angus Maddison.HT: FT Alphaville
On a per capita basis, there is a huge spurt of growth between World War II and 1970. There is also a small spurt about the time of World War I, and a new spurt in growth recently, as a result of growing coal usage in Asia....MUCH MOREFigure 2. Per capita world energy consumption, calculated by dividing world energy consumption shown in Figure 1 by population estimates, based on Angus Maddison data.
Tuesday, March 13, 2012
Chart Porn: World Energy Consumption Since 1820
From Our Finite World:
