From the University of Nebraska-Lincoln, July 23:
This Week's Drought Summary
This U.S. Drought Monitor (USDM) week saw degradations across the areas of the Plains, Upper Midwest, and Florida, while rainfall during the past week led to improvements in drought-affected areas of the South, Southeast, Mid-Atlantic, and Northeast. In the West, a mix of improvements and degradations occurred on the map with improvements across areas of Idaho and Montana in response to above-normal rainfall during the past 30-day period. Conversely, areas of eastern Colorado and southeastern Wyoming saw degradation in response to dry conditions and excessive heat and elevated evaporative demand. Likewise, hot and dry conditions prevailed across the central and northern Plains leading to expansion and intensification of drought, with temperatures ranging from 2 to 10+ °F above normal and reports of poor rangeland conditions. In the South, another round of heavy rainfall in the Hill Country of Texas led to continued improvement in the long-term drought situation as well as severe flash flooding, with widespread rainfall accumulations ranging from 5 to 10 inches and isolated areas receiving totals in excess of 15 inches during the past week. In the Southeast and Mid-Atlantic, isolated shower activity led to improvements in drought-affected areas of Florida, Georgia, the Carolinas, and Mid-Atlantic states. Similarly, isolated areas of the Northeast received heavy rainfall accumulations ranging from 2 to 5+ inches, leading to improvements in New Jersey, New York, Connecticut, and Massachusetts.
In terms of reservoir storage in the West, California’s reservoirs continue to be at or above historical averages for the date (July 21), with the state’s two largest reservoirs, Lake Shasta and Lake Oroville, at 110% and 100% of average, respectively. In the Southwest, the U.S. Bureau of Reclamation is reporting (July 19) Lake Powell at 22% full (34% of average for the date; lowest on record for the date in the last 30 years), Lake Mead at 27% full (45% of average for the date; lowest on record for the date in the last 30 years), and the total Colorado River system (July 19) at 33% of capacity (compared to 39% of capacity the same time last year)....
....MUCH MORE
The experimental Drought Severity and Coverage Index (DSCI) decreased one point (on a 0 - 500 scale where 500 equals Martian dryness) from 153 to 152.
That said the states that draw water from the Colorado River are still arguing about who gets what. At this rate Las Vegas will return to its desert state before anything is agreed.
The current map:

Vs. last week:

Previously:
July 16, 2026
Drought Severity Continues Slow Improvement
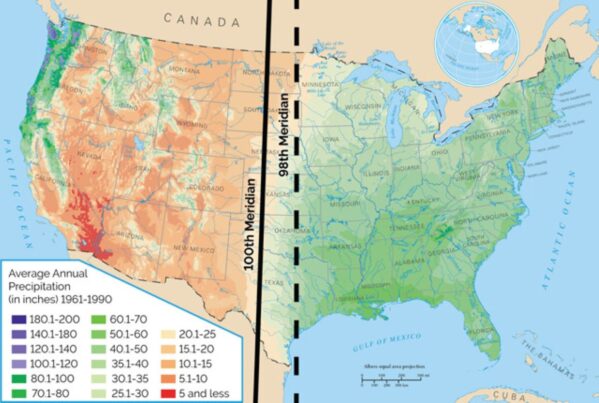
Our area of interest is the agricultural land on either side of the Mississippi river from Canada to the ¿Golfo de América? Roughly from the 100th meridian in the west to a north - south line on Indiana's eastern border (the "First Principal Meridian"), approximately longitude 84° 48′ 50″ west.