The fuel that investments (and economies) run on.
From the Bank for International Settlements, July 31:
Key takeaways
- Cross-border bank credit rose by 11% year on year at end-March 2026. The expansion was broad-based across instruments and counterparty sectors.
- Bank credit to emerging market and developing economies expanded by $148 billion in Q1 2026, primarily concentrated in Africa and the Middle East and emerging Europe.
- The BIS global liquidity indicators exhibited robust growth in foreign currency credit denominated in US dollars and euros, with the latter expanding at a relatively faster pace.
Cross-border bank credit maintained strong momentum
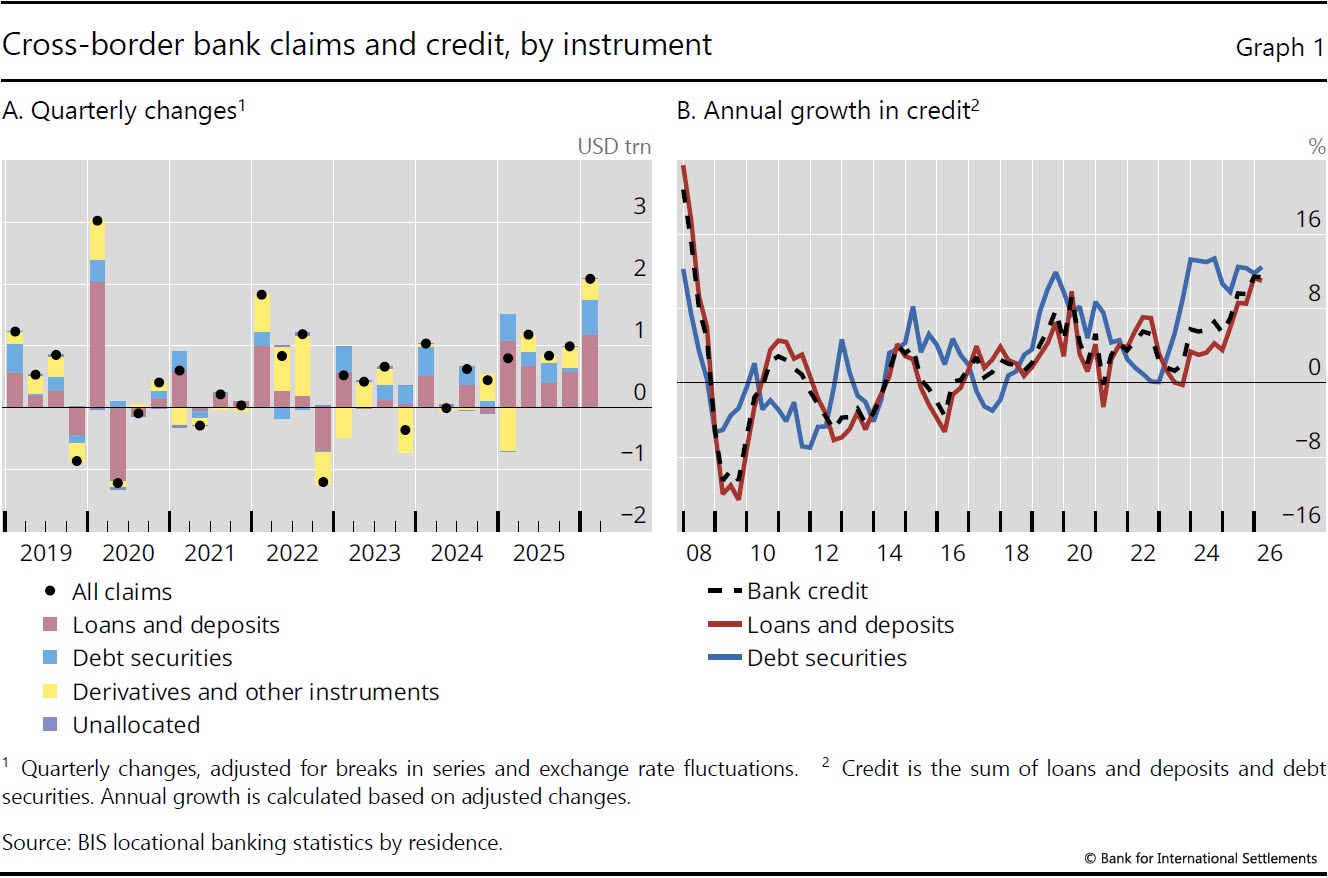
The BIS locational banking statistics (LBS) reveal that global cross-border bank claims1 rose by $2.1 trillion2 in the first quarter of 2026, on an exchange rate- and break-adjusted basis (Graph 1.A). This brought their total outstanding stock to $47.6 trillion.
Cross-border bank credit rose by $1.7 trillion in Q1 2026, marking an 11% year-on-year increase and sustaining the momentum from 2025 (Graph 1.B, black line). Its outstanding stock reached $39.5 trillion at end-Q1 2026. The expansion was driven by cross-border bank loans and deposits as well as banks cross-border holding of debt securities, which increased by $1.2 trillion and $0.6 trillion, respectively. Both measures recorded strong annual growth rates, at 11% and 12%, respectively (red and blue lines). The annual growth of cross-border bank credit has remained consistently positive for the past five years.
The expansion in cross-border bank credit was broad-based across counterparty sectors.3 Credit to banks rose by $632 billion in Q1 2026 (Graph 2.A, blue bars). This took its annual growth rate to 11% as of end-March 2026, the highest since the onset of Covid-19 (Graph 2.B, blue line). Meanwhile, credit to the non-bank sector rose by $1.1 trillion in Q1 2026 (Graph 2.A). Its year-on-year growth rate positive since Q1 2023 reached 12% as of end-March 2026 (Graph 2.B, red line). Within the non-bank sector, credit to non-bank financial institutions (NBFIs) and to the non-financial sector (NFS), expanded by $651 billion and $453 billion, respectively (Graph 2.A, purple bars)....
....MUCH MORE, including links to the data and the complete release (19 page PDF)
Partaaay!

