The Federal Reserve's Explanation Of What Happened In The Money Markets In September 2019
For now this is just a personal bookmark but we may be referring back to it. What was going on in Q3 and Q4 2019 was a big enough deal that the Fed felt compelled to publish this little bit of narrative.
What seems to have happened was that somebody's derivative book got upside down to the tune of a few trillion dollars (notional, always say notional) and in addition the contagion through the counterparty daisy chain was also in the trillions and well, here's the Fed with their version.
From the Board of Governors of the Federal Reserve System:
In mid-September 2019, overnight money market
rates spiked and exhibited significant volatility, amid a large drop in
reserves due to the corporate tax date and increases in net Treasury
issuance. Although some upward pressure on money market rates due to
these seasonal factors was expected, the extent of the increase in both
the level and volatility of rates in secured and unsecured markets was
surprising. In this note, we review the money market events of September
2019 and discuss the factors that may have contributed to the sharp
rate movements in the repo market and the associated pressures in the
fed funds market.
What happened?
The moves in both secured and unsecured rates on September 16 and 17
were much larger than any of those observed over the past few years.
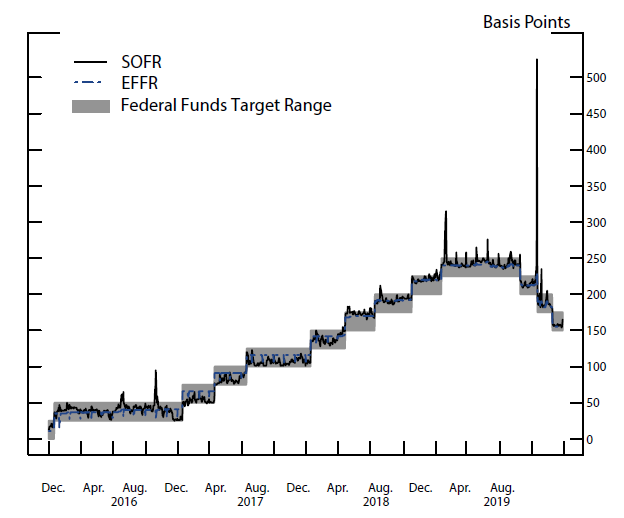
Figure 1 shows the effective federal funds rate (EFFR) and the secured
overnight financing rate (SOFR), a broad measure of the cost of
borrowing cash overnight collateralized by Treasury securities, since
December 2015. The EFFR has been quite stable and only printed outside
the FOMC's target range on one day before September 17. While SOFR has
been more volatile compared to the EFFR and exhibited some quarter-end
seasonality, it rarely moves more than 20 basis points on a day.
Figure 1: SOFR and EFFR
Source: Data available on FRBNY public website. Note: Daily prints of SOFR and EFFR from December 1, 2015 to September 30, 2019. Accessible version
On Monday, September 16, SOFR printed at 2.43 percent, 13 basis
points higher than the previous business day. With pressures in the repo
market spilling over into the fed funds market, the EFFR printed at
2.25 percent, 11 basis points above the Friday print and at the top of
the FOMC's target range. On September 17, the EFFR moved above the top
of the target range to 2.3 percent and the SOFR increased to above 5
percent.
Figures 2 and 3 show the shift in the distribution of trades in the
repo market and the fed funds market, respectively. On September 16 and
17, the range of trades in both markets expanded significantly and rates
shifted higher. Following the repo operations by the Federal Reserve
Bank of New York (FRBNY), announced on September 17, the distribution of
rates in both markets reverted closer to the average distributions
observed over the year the next day....
I have a feeling that lands somewhere in "the nebulous region between mere suspicion and probable cause"
(LaFave & Israel on U.S. v. Ramsey, 431 U.S. 606 [1977])
that there is some sort of misdirection going on that I'm not understanding.
If
so, any attempt at analysis of Fed policy and market moves by
traditional means, global macro, central bank policy and practice,
market internals such as options gamma etc., etc. is just so much
blather.
And I keep coming back to the 3rd and 4th quarters of 2019 as the period when things were getting very weird.