This is NOT a forecast of imminent doom for equities.
Rather it is a reminder of what happened, and how fast it happened, when last a so-called mature market approached escape velocity on the charts. First up, from ZeroHedge, July 1, the trigger for this meander down Memory Lane:
These Are the Two Most Horrifying Charts I’ve Seen in a Long-Time
Over the last three days, I’ve been outlining how the Fed “spooked” the bond markets into believing it will move to crush inflation sometime in the next 18 months.
Yesterday we detailed why the Fed would do this, namely because long-term bond yields represent the “growth expectations” against which stocks are priced. So provided these yields are falling to new lows, stocks can continue to rise to new highs.
Put another way, the primary means through which the Fed can keep the “music playing” for the bull market is by manipulating the markets into buying ever cheaper and cheaper debt.
This will allow stocks to go to truly spectacular bubble territory. Yesterday I posited that we could even see the S&P 500 rise to 5,000.
However, it’s important to note the risks associated with this monetary policy. And those risks are clearly illustrated in the below chart.
This is a long-term chart of the S&P 500 along with its 50-month and 200-month moving averages (MMAs).

As you can see, the 50-MMA is of extreme importance to the stock market. During bull markets, the S&P 500 usually bounces hard off this line. And at the start of bear markets, a breakdown below this line is usually the first sign that a bull market is over.
The key item I want to draw your attention to is just how stretched the S&P 500 is above its 50-MMA. The below chart has an added lower box that shows stocks are currently 38% above this level. It’s also worth noting that the market has only been more stretched above this level two times: during the Tech Bubble of the late ‘90s and right before the 1987 Crash.
Suffice to say, both of those instances resulted in pretty dramatic drops.

It’s important to note that the fact stocks are this stretched above the 50-MMA doesn’t necessarily mean that stocks will crash right here and now. As I’ve just detailed, stocks have in fact been even more stretched than this before during other bubbles.
Moreover, with the Fed making it clear it wants stocks to roar even higher, we could indeed see stocks become even MORE stretched above their 50-MMA. It’s never smart to fight the Fed. And until stocks do “something wrong” I wouldn’t sell the farm just yet....
....MORE
That is some pretty nice verticality, The Swiss Alps are envious.
And from CNN, April 14, 2000:
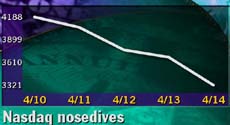
Bleak Friday on Wall Street
Unnerved investors rapidly unload stocks amid inflationary fears
By Staff Writer Catherine Tymkiw
But the statistical standout could be this: the Nasdaq fell more than 25 percent this week, trouncing the 19 percent fall that began Oct. 21, 1987, Black Monday.
Friday's plunge came after the government said prices at the consumer level showed surprising strength last month, triggering fears that the Federal Reserve may raise interest rates more aggressively.The Nasdaq composite index shed 355.61 points, or over 9 percent, to 3,321.17, its biggest one-day decline on record. At one point during the trading session, the Nasdaq was down 411 points. The index lost over 1,000 points this week and is now off more than 34 percent from its record high set March 10 - well beyond the 20 percent decline Wall Street sees as the beginning of a bear market....
Yes indeed it was the beginning of a bear market.
Here's Mt. NDX (Naz100) note the period 1998 to 2002:

On Friday March 10 the broader Nasdaq index closed at 5048.62, its then-all-time high.
On the following Monday the Naz was down 141 points. Tuesday, 200.
The index had begun a 30-month decline to it's September 24, 2002 intra-day low of 1,169.04,
down 77%.
Back to the Nasdaq 100, the powers that be quit publishing the P/E: there were so many money-losing SPACs companies that the number had become meaningless.
And back to that long ago CNN story, a couple of the sub-heads:
"....Economic data sparks sell-off...."
"....Strong earnings not enough to attract buyers...."
Good times.