We've been posting our best guess of a market downturn in 2019 and a recession in 2020 but first, more new highs, and the recent action seems to fit that framework. The two biggest drivers are rising rates boosting the banks and trade news affecting psychology.
As long as China, Canada and the EU are still talking to the U.S. the animal spirits will be contained and exuberance won't get to psychotic-break irrational levels. Meaning there is more upside.
This week's action was led by the financials, here's the S&P Financial Sector SPDR ETF:
Here's StockCharts yesterday pointing out the change in leadership:
...Current Outlook
One of the more bullish developing stories for equities is actually taking place outside the equity markets. Yesterday, the 10 year treasury yield ($TNX) closed at 3.05%, a definitive breakout of its boring 2.81%-3.01% range that it had been mired in for the past 3-4 months. That means that money is rotating in significant fashion OUT of the more defensive treasury market. Always remember that there's a perfect 100% inverse relationship between treasury prices and treasury yields. When treasuries sell off, yield rise. It's that simple. And when treasuries are sold, what happens to the proceeds? Well, treasuries generally sell off as economic conditions strengthen. Strengthening economic conditions are typically a boost to Corporate America's bottom line which, in turn, leads to higher S&P 500 prices. That's why there's a positive correlation between the direction of the TNX and the direction of the S&P 500. The TNX still must negotiate the high it established in May 2018 at 3.11%. A breakout there could lead to a rush of buying in U.S. equities. I believe it will happen. Here's the intermediate-term view of the TNX:
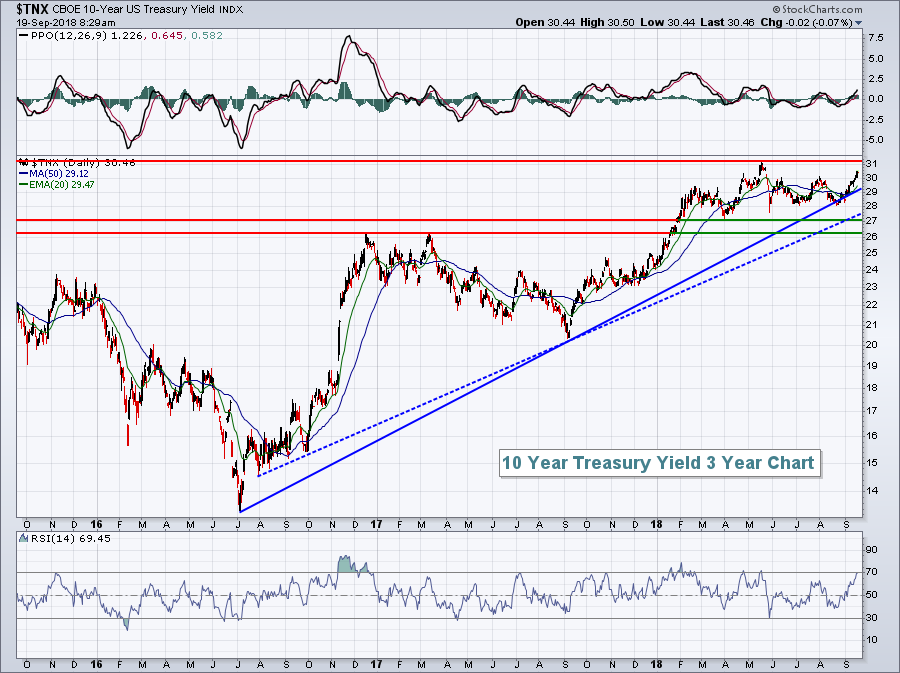
The intermediate-term trading range for the TNX is the double top breakout of 2.62% as yield support and the May 2018 high of 3.11% as yield resistance. I've drawn a couple trendlines on this chart, but trendlines are dangerous because you can rather subjectively draw the lines to connect whatever you want. The solid blue line above connects key lows since the July 2016 low. The problem here is the few number of intersecting points. Trendlines are only as strong as the number of price points they connect. While it's difficult to say which yield point is most important on this chart from a trendline perspective, I can say that TNX support near 2.62% is very critical to this intermediate-term chart.He goes on to talk some negative calendar stuff but there are too may computer looking at the "historically worst day of the year" for it to matter any more.
A breakout above 3.11% is exactly what the bulls want to see. Don't listen to the "higher interest rates are bad for the economy" hype....MORE
Finally, here's Investor's Business Daily with some interesting commentary
The Dow Jones industrial average and the S&P 500 rose to record highs in a broad rally that also gave the Nasdaq composite its best gain since Aug. 29 in the stock market today.
The Dow added nearly 1% to clear the previous high marked on Jan. 26. The S&P 500 topped its Aug. 29 high with an increase of 0.8%. The Nasdaq was up 1% and closed back above the 8000 level. It still needs to rise about 1% to make a new high.
Indexes also closed near session highs, demonstrating lasting strength. Small caps also were among the strongest stocks, with the Russell 2000 up 1%.
Volume rose from Wednesday's levels, according to early figures. Breadth was impressive, with winners over losers by 2-1 on the NYSE and by better than 13-5.
But leading stocks lagged, with the IBD 50 rising a comparatively weak 0.4% late Thursday. Internet components Match Group (MTCH) and Momo (MOMO) fell 3.2% and 2.6%, respectively. But in general there were no major declines on winners in the IBD 50. About one-third of the list was flat or lower.
Nvidia (NVDA) was a surprising IBD 50 decliner on a day when semiconductor stocks were mostly higher. The Philadelphia semiconductor index jumped 1.2%. the Leaderboard stock fell after a Morgan Stanley analyst said uptake of the new GeForce 2080 products is likely to be slower than originally forecast. The stock fell modestly below the 269.30 ideal buy point.
On the Dow, Intel (INTC), Caterpillar (CAT), DowDuPont (DWDP) and Walgreens Boots Alliance (WBA) climbed 2% or more to lead the industrials.......MORE
IBD is probably the best quick look at the markets currently being written and something we'll be going to a bit more often as equities explore new territory. Also on the blogroll at right.