Unraveling the Oil Conundrum: Productivity Improvements and Cost Declines in the U.S. Shale Oil Industry
Ryan Decker, Aaron Flaaen, and Maria Tito 1 Oil prices have declined by roughly 70 percent since peaking in the middle of 2014. The U.S. oil rig count--a common measure of drilling activity--peaked in late 2014 and has since declined by about 60 percent. Yet U.S. production of crude oil continued rising until the middle of 2015 and has since fallen by only 6 percent from its peak. The dramatic advance of U.S. oil production seen in the last decade--driven primarily by new discoveries of shale oil and innovation in drilling and extraction technology--has not been as responsive to the deterioration of oil markets as some analysts predicted.2
Why have large declines in prices and in the rig count not triggered a more dramatic decline in production? At what price level would a large share of U.S. shale oil production lose economic viability? In this note, we explore these questions with a focus on the U.S. shale oil industry in the Bakken, Eagle Ford, and Permian Basin regions.3 We describe large productivity improvements in drilling and fracking methods that have allowed production to remain strong despite falling rig usage. We then document cost declines that have preserved profitability for many firms even in the midst of historically low prices.
The Resilience of Production
The dramatic increase in total U.S. oil extraction between 2011 and mid-2015 was driven almost entirely by unconventional production in geologies such as shale; these areas now account for more than half of U.S. output. The recent decrease in extraction has likewise been concentrated in unconventional production.4 This decline has been moderate in light of the large collapse in prices and in the rig count. One explanation for the modest response of production to the deterioration of the oil market is the high pace of productivity growth seen by the shale extraction industry in recent years.
| Figure 1. Rig Counts and Wells per Rig, Bakken Region |
|---|
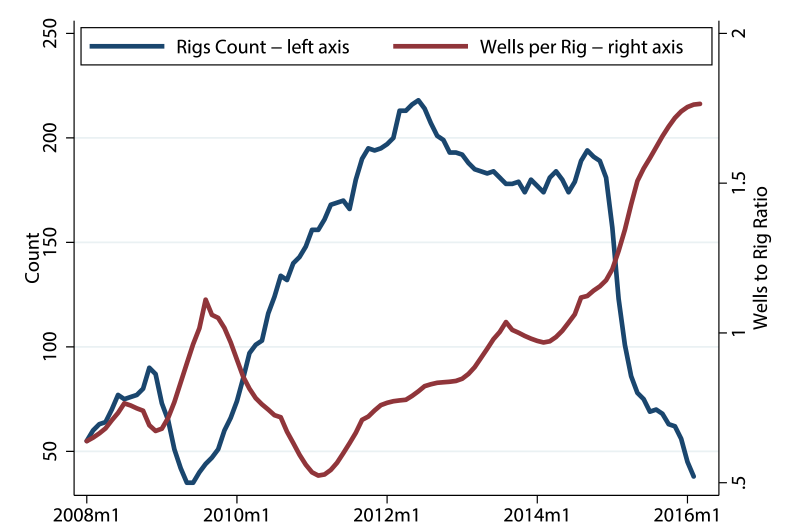 |
Source: U.S. Energy Information Administration (EIA), Drilling Productivity Report, March 2016
Accessible version
Increased and more efficient use of water, sand, and other proppants in the fracking process has further enhanced the productivity of oil wells, particularly early in the well lifecycle.6 As a result, in addition to the increase in the number of new wells per rig, the extraction from these new wells in their first month of production has roughly tripled since early 2008.7 These improvements can be best illustrated by examining well decline curves, which track productivity over a well's lifecycle.
| Figure 2. Average Well Decline Curve by Cohort |
|---|
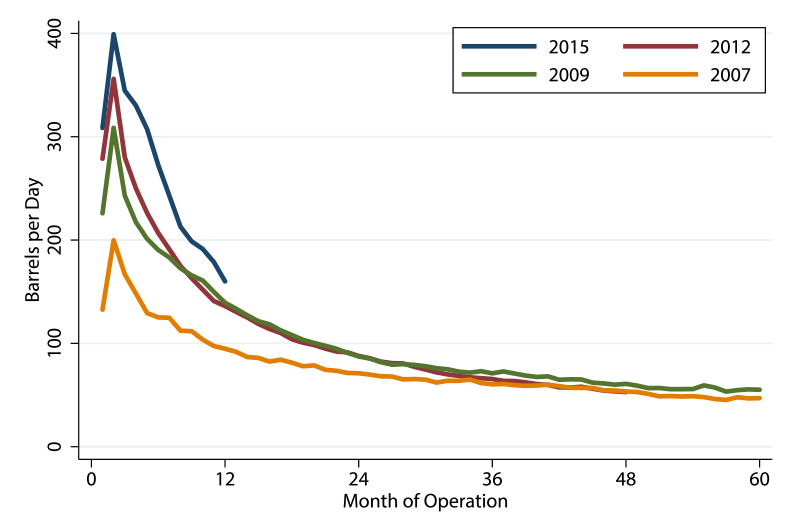 |
Source: Authors' calculation from Dept. of Mineral Resources, North Dakota
Note: Average well decline curves for Bakken.
Accessible version
| Figure 3. Well Decline, Controlling for Well Size |
|---|
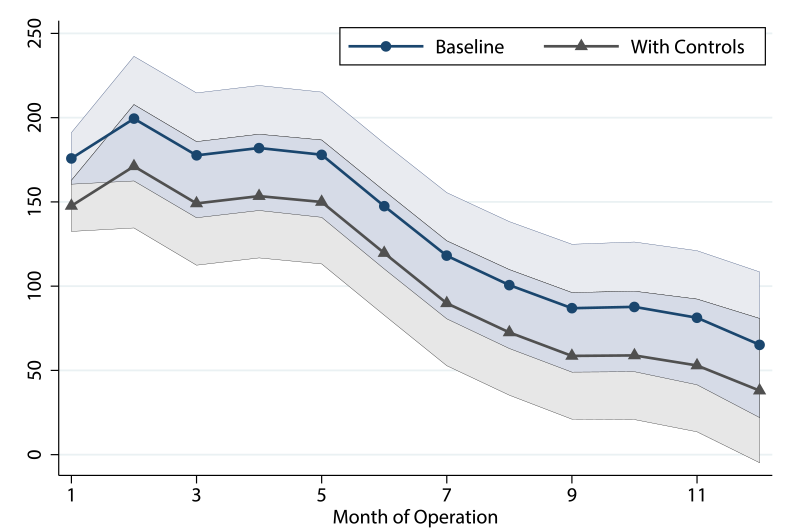 |
Note: Shaded areas represent 95% confidence intervals around the point estimates.
Accessible version
Other lifecycle and composition issues can provide further insights into aggregate production. Figure 4 decomposes the change in monthly oil production from all regions into the positive contribution of new wells (the blue line) and the negative contribution from existing wells (the red line), the latter being almost invariably negative as a result of the natural lifecycle declines depicted in Figure 2. Consequently, aggregate production increases whenever output from new wells (the blue line) exceeds the natural output declines among existing wells (the red line). Despite productivity improvements, output from new wells began falling in mid-2015 as the number of well completions dropped significantly. This pushed the positive contribution from new wells below the negative contribution from existing wells, resulting in aggregate production declines. It is noteworthy, though, that the drag from existing well declines peaked shortly thereafter, mitigating the fall in aggregate output. Completions of larger wells and productivity improvements among legacy wells have softened the negative pull from existing wells.
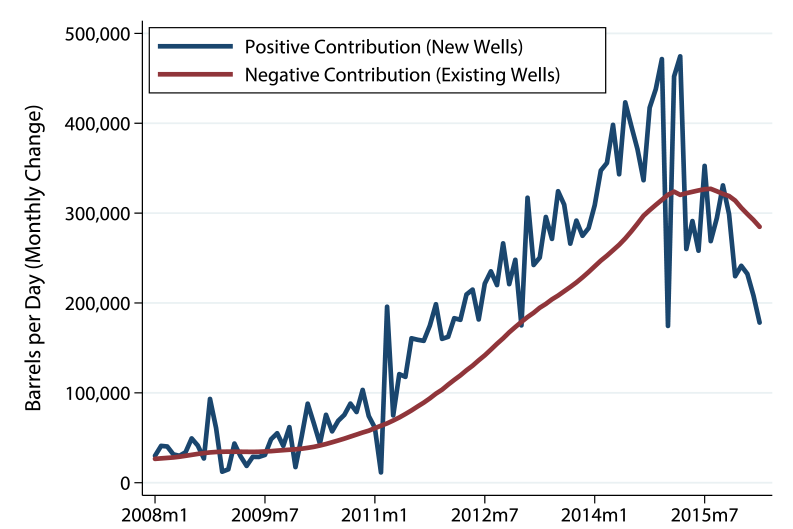
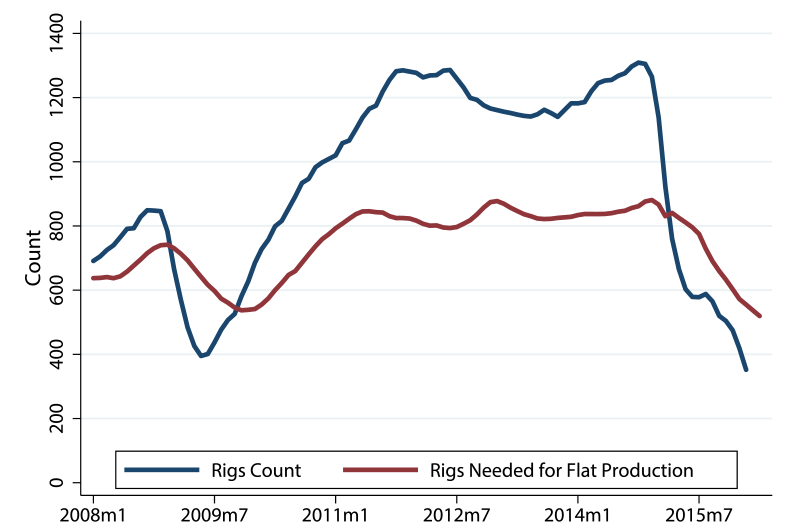
Figure 5 provides another way of understanding composition effects behind production, the number of rigs needed to maintain a constant production level, that is, rigs needed for flat production (RNFP). This measure is constructed by calculating the number of new rigs necessary to offset observed declines from existing wells, using the prior month's estimate of new production per rig. As rig efficiency has increased and legacy-well decline curves have shifted up, and as total production has gradually fallen, the RNFP has declined. This framing highlights a decreasing usefulness of the rig count as a sole indicator of overall activity.
General equilibrium mechanisms have also affected the oil production climate. Lower drilling activity combined with productivity enhancements have reduced the demand for workers, and wages of workers in the Natural Resources and Mining sector have declined by 10 percent or more in the three main shale regions.8 Service costs have fallen by about 30 percent in the shale regions (Curtis 2015), with anecdotal reports even indicating that some service firms are performing tasks for free to retain market share. Diesel fuel and other energy sources are key production inputs, and their costs have fallen mechanically with oil prices. Using cost share estimates from the Energy Information Administration (EIA) from 2009, we construct a back-of-the-envelope estimate that labor, services, and fuel cost reductions have collectively reduced overall production costs by more than 10 percent.9 Other costs have fallen with broad market conditions as well, most notably royalties and taxes (which often depend nonlinearly on prices).10
Additional productivity improvements and cost reductions have resulted from the aggressive reallocation of drilling and operating activity toward high-productivity plays and rigs as well as from the failure or acquisition of low-productivity, high-cost firms.11 Considering the recent productivity improvements, how should we expect aggregate production to evolve in coming months and years? The EIA, accounting for the various productivity and lifecycle factors described above, forecasts total U.S. oil production to gradually fall to about 8.2 million barrels per day in early-2017, flattening out thereafter (U.S. Energy Information Administration 2016b).
Economic Viability of Shale Production
In recent years, companies have made extensive efforts to reduce drilling and production costs. Cost estimates vary widely, reflecting substantive variation in regional and company-specific costs, ambiguity about the details of cost estimation, and general uncertainty. Our goal is to generate a range of estimates that can inform our view of the economic viability of continued shale oil production....MORE
HT: The Big Picture