From Bloomberg Prophets, in this case Jim Bianco, Feb. 25, 2017
Passive investing doesn't discriminate between individual winners and losers.
In 2016, analysts at Sanford C. Bernstein & Co. offered a powerful critique of passive investing.
In “The Silent Road to Serfdom: Why Passive Investing is Worse Than Marxism,” they wrote that “a supposedly capitalist economy where the only investment is passive is worse than either a centrally planned economy or an economy with active market led capital management.”
Hyperbole aside, the team led by Bernstein’s head of global quantitative and European equity strategy, Inigo Fraser-Jenkins, has a point. If capitalism is supposed to reward good ideas and punish bad ones, how does a binary passive investment of “in or out” that doesn’t discriminate between individual winners and losers accomplish this? Granted, passive investing has provided superior returns over active investing in recent years, but is it the best way to allocate capital resources? Although passive investing has not created any stress in the markets yet, the high-yield market is one area where there could be problems during volatile times.
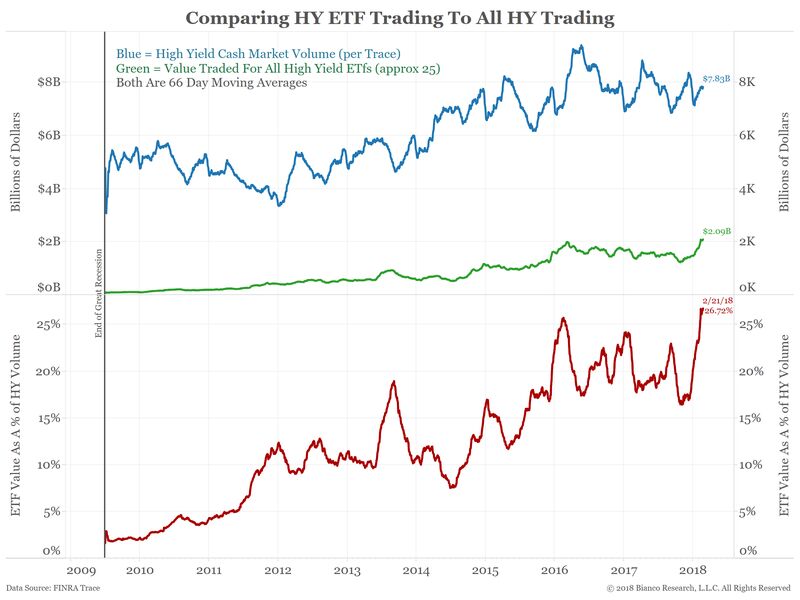
Consider the chart below. The blue line shows the dollar value of daily high-yield cash bond trading. The green line shows the daily trading value of the roughly 25 exchange-traded funds that own high-yield securities. BlackRock’s iShares iBoxx High Yield Corporate Bond ETF (HYG) and Barclay’s SPDR High Yield Bond ETF (JNK) account for about two-thirds of this total.
The red line in the bottom panel shows high-yield ETF dollar volume as a percentage of the cash market. ETF trading volume is currently at a new high at about 27 percent of the underlying cash market. This measure was under 2 percent after the financial crisis in 2009.

In other words, more than 25 percent of high-yield trading is ETF-related. For comparison, less than 6 percent of investment-grade trading is ETF-related. ETFs of other markets, such as small caps, domestic stocks, emerging markets or gold, make up less than 2 percent of their respective cash market. Because of high-yield ETFs’ unique size relative to the underlying cash market, junk bonds would be one place where passive investing could distort individual prices.
The next chart shows a 66-trading day rolling correlation between the option-adjusted spread, or OAS, for the major high-yield sectors and the one for the broad high-yield index. The black line shows the average of these 11 measures. Starting in late 2014, about the same time high-yield ETFs’ influence started to grow, the average correlation of the sectors to the high-yield market rose from less than 0.5 to above 0.8.

...MUCH MORE...To update Karl Marx’s famous dictum, “From each according to ETF flows, to each according to their index weighting.”