During our last installment in the series in the February 15th WILTW, we drew the connection between the sharp slowdown in M2 growth — the result of the Fed’s tighter monetary policy and short-term, interest-rate hikes — and rising M2 velocity, as dictated by the relationship M2V=NGDP/M2. Anything that alters the direction of M2 will have the opposite effect on velocity, all else being equal. Therefore, tighter monetary policy (evidenced by falling M2 growth) and higher interest rates can lead to rising velocity, which has historically been closely associated with rising inflation and inflation expectations.The five-year breakeven inflation rate, a measure of intermediate-term inflation expectations, has recently surged to a three year high of 2.05%. And, during the past 18 months, the upward trend in the breakeven rate (blue line below) has coincided with shrinking growth in the M2 money supply (red line). The rising breakeven rate has been driven by the rising yield on five-year USTs outpacing the yield increase of five-year Treasury Inflation-Protected Securities (TIPS), which have benefited from relatively stronger demand than their non-indexed UST counterparts.
5-year UST/TIPS breakeven inflation rate (blue, lhs) vs. year-over-year growth of M2 money stock (red, rhs), March 2015 to March 2018
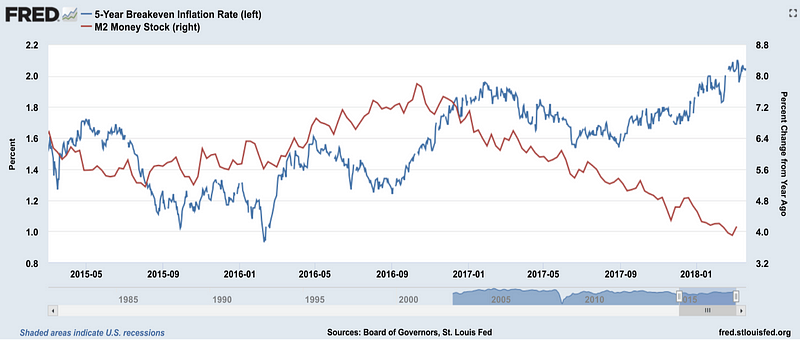
Source: St. Louis Fed
A March 12th Bloomberg article, headlined “Investors Brace for Inflation to Come Roaring Back,” elaborated on how “TIPS have become the sanctuary for the once-ubiquitous ‘bond vigilantes’.”“Why would investors show so much alarm by embracing TIPS when trader bets and the Fed’s favorite measure of inflation showed nothing to get excited about? The answer is we’ve seen this motion picture before, and it didn’t end well. [During the period between] 2001, when the Bush tax cuts began, and June 2006, when the Fed last raised interest rates before the financial crisis, the surplus (2.6 percent of GDP) turned into a 3.8 percent deficit [at its nadir]. The unemployment rate, hovering near a 40-year low of 3.9 percent, climbed to 6.3 percent [at its high]. The implied volatility of U.S. government bonds, a measure of investor uncertainty on the economy, increased 53 percent to 161 from 105. And inflation, measured by the Personal Consumption Expenditure index, quickened to 2.4 percent [at its high] from 1.8 percent.During this period when the financial system was hurtling toward the breaking point and the economy was deteriorating, TIPS proved superior, returning 49 percent when the rest of the Treasury market gained 28 percent, the Bloomberg Barclays Indexes show.”We have long argued that while QE was deflationary for commodities, it was inflationary for financial assets, especially stocks and bonds. One could therefore argue that reversing QE (via QT) will trigger considerably more volatility in both the stock and bond markets in the months ahead, as cost-of-capital assumptions increase, opportunity-costs rise, earnings multiples contract and credit stress intensifies among highly-leveraged businesses (see section 2).It is worth pointing out that rising M2 velocity does not necessarily imply an acceleration of real GDP growth. As the experience during the early-and-late 1970s illustrates, velocity can increase even while real GDP growth is receding, as indicated by the green arrows in the following chart....
...MORE