Does the algo give you a listless "Oh, all right" when you offer up the same stale mush?
There is a solution. Start the day with some yummy numbers from the U.S. Department of Agriculture and turn that morning frown upside down.
From the USDA's National Agricultural Statistical Service April 2018 report, such topics as:
Contents
Preface
Field Crops Records for Acreage, Yield, Production, and Ending Stocks
Principal Crops Area Planted and Harvested United States: 1909 - 1990That only gets us into the "C's". In all there are, 240 pages of (number) crunchy goodness!
Principal Crops Area Planted and Harvested – United States: 1983 - 2017
Barley Area Planted and Harvested, Yield, Production, Price, and Value – United States: 1866 - 2017
Canola Area Planted and Harvested, Yield, Production, Price, and Value – United States: 1991 - 2017
Corn Area Planted and Harvested, Yield, Production, Utilization, Price, and Value – United States:
1866 - 2017
And while the machine is whirring away you can give yourself some visual stimulation with the USDA Economic Research Service's ERS Charts of Note!
Each day, delicacies delivered direct to you. Such morsels as:
April 11
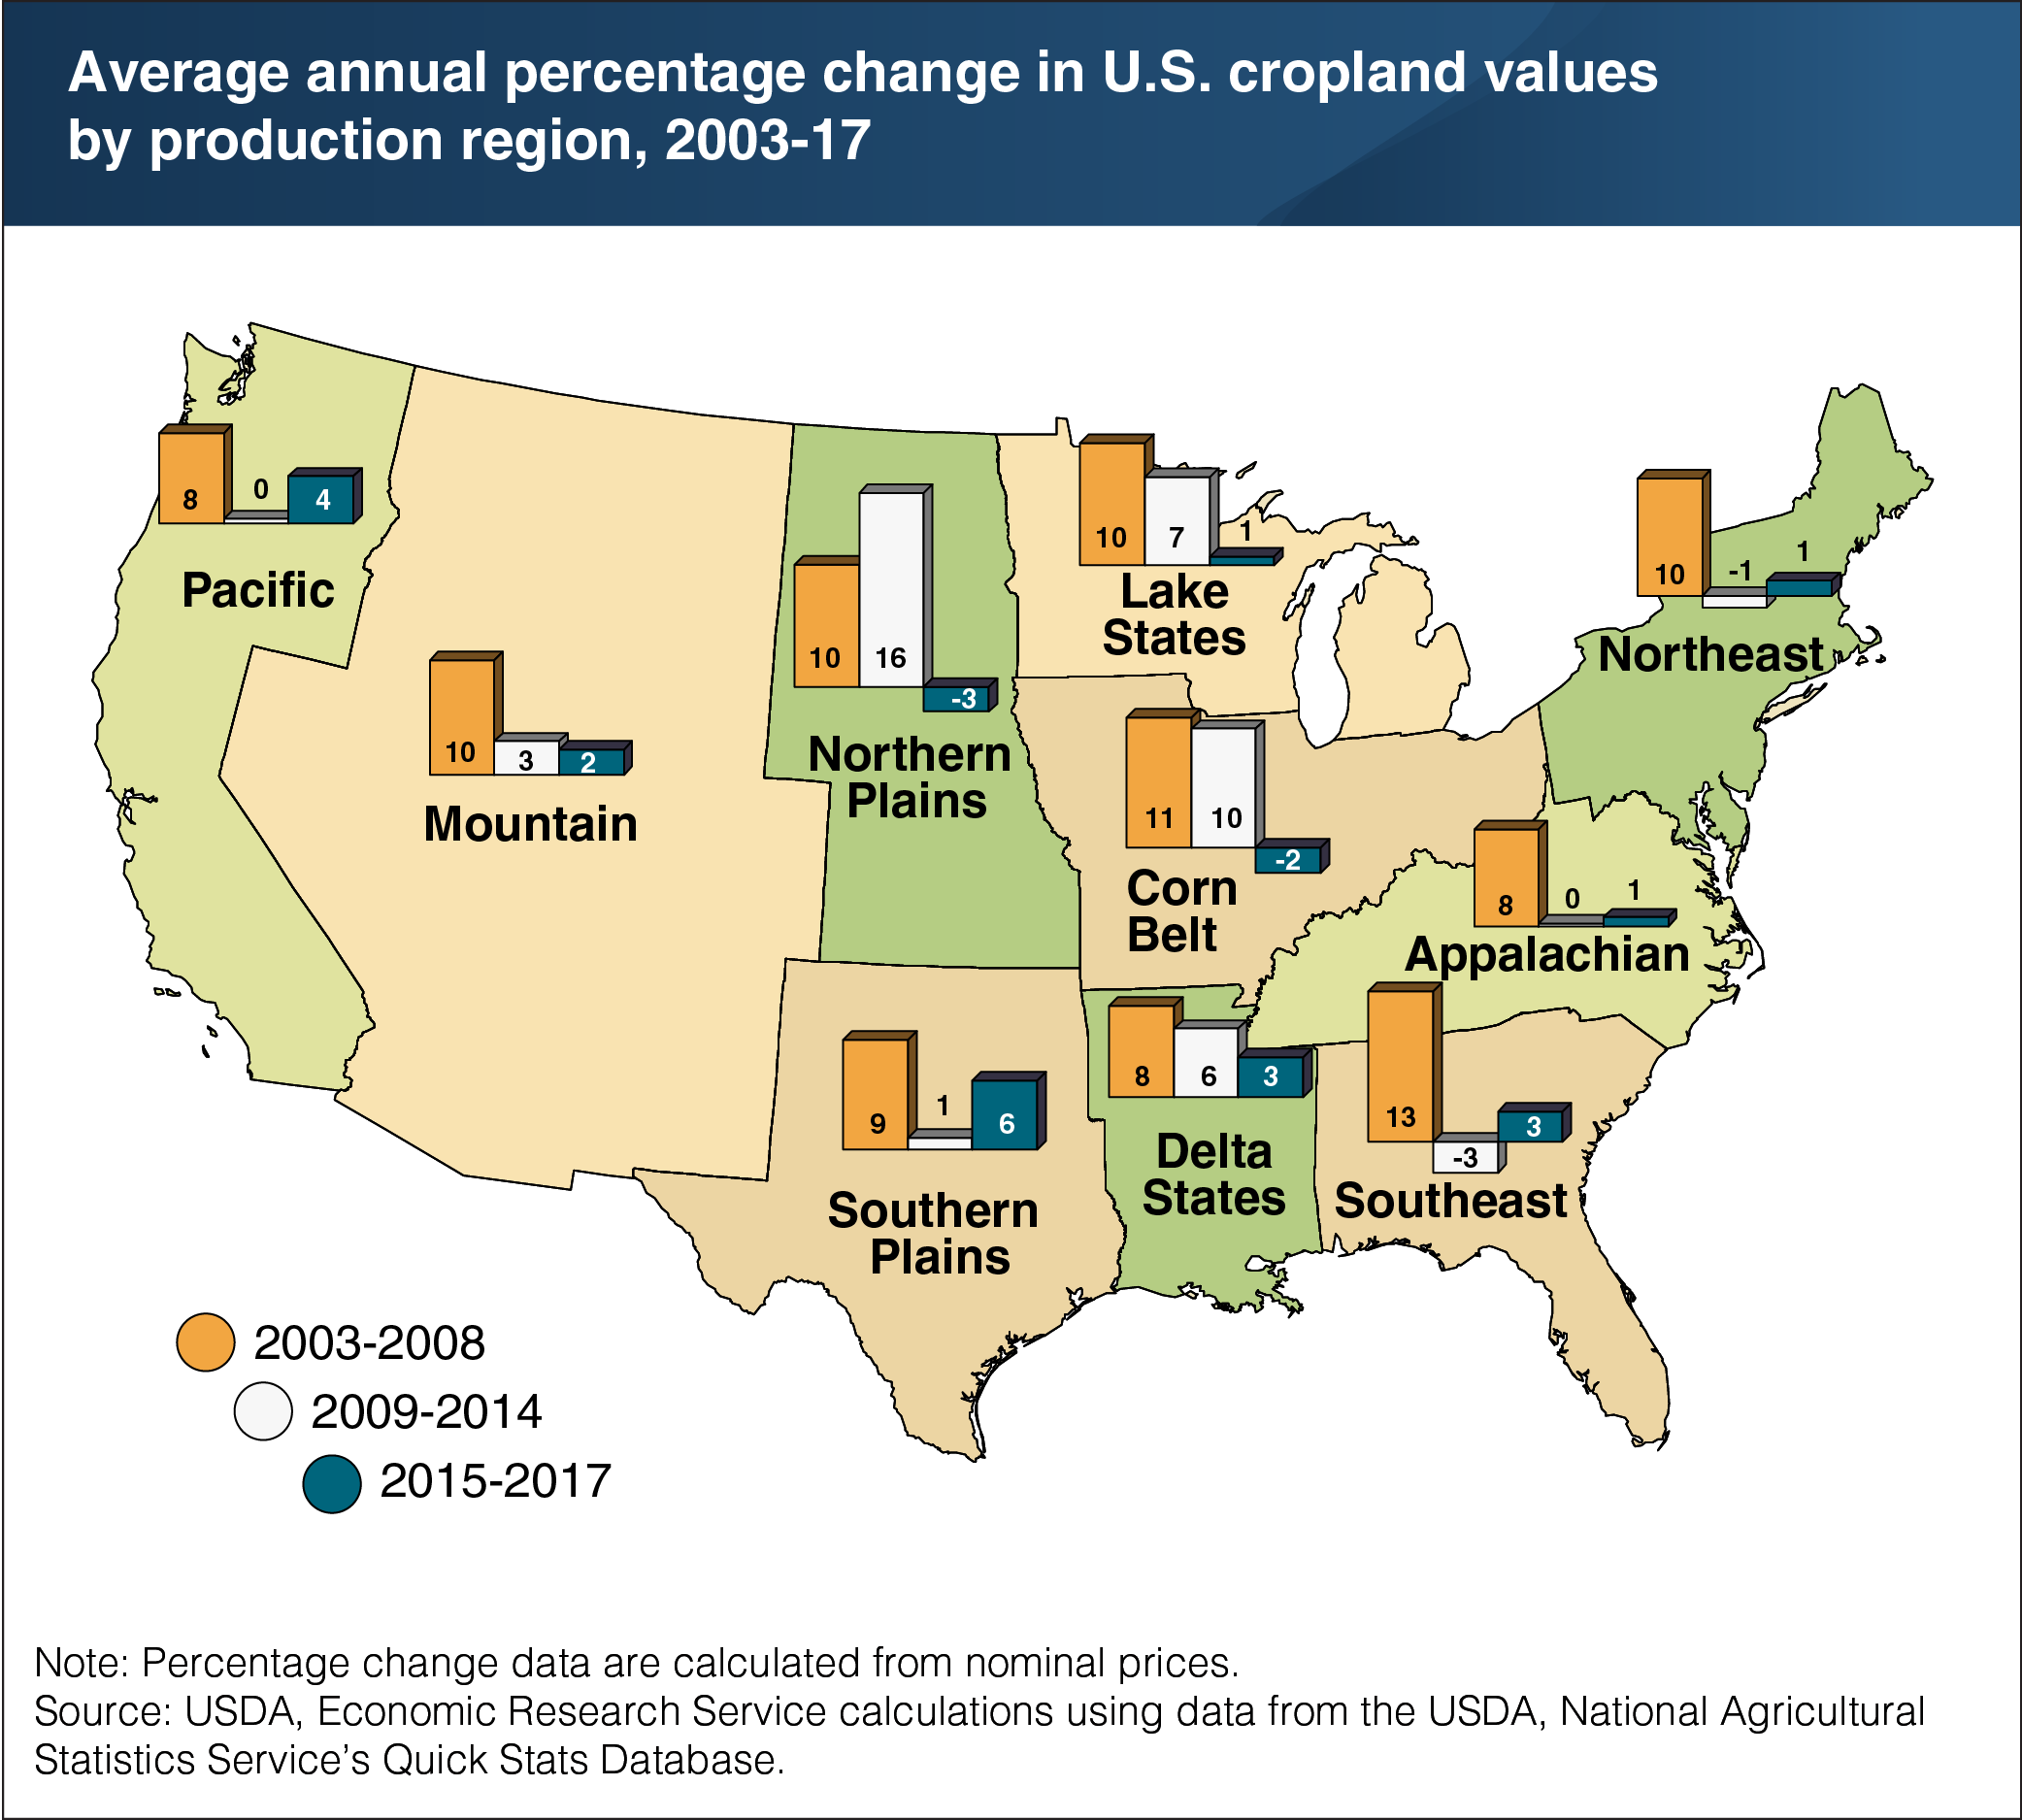
Appreciation in U.S. cropland values varies by region and over time

April 10
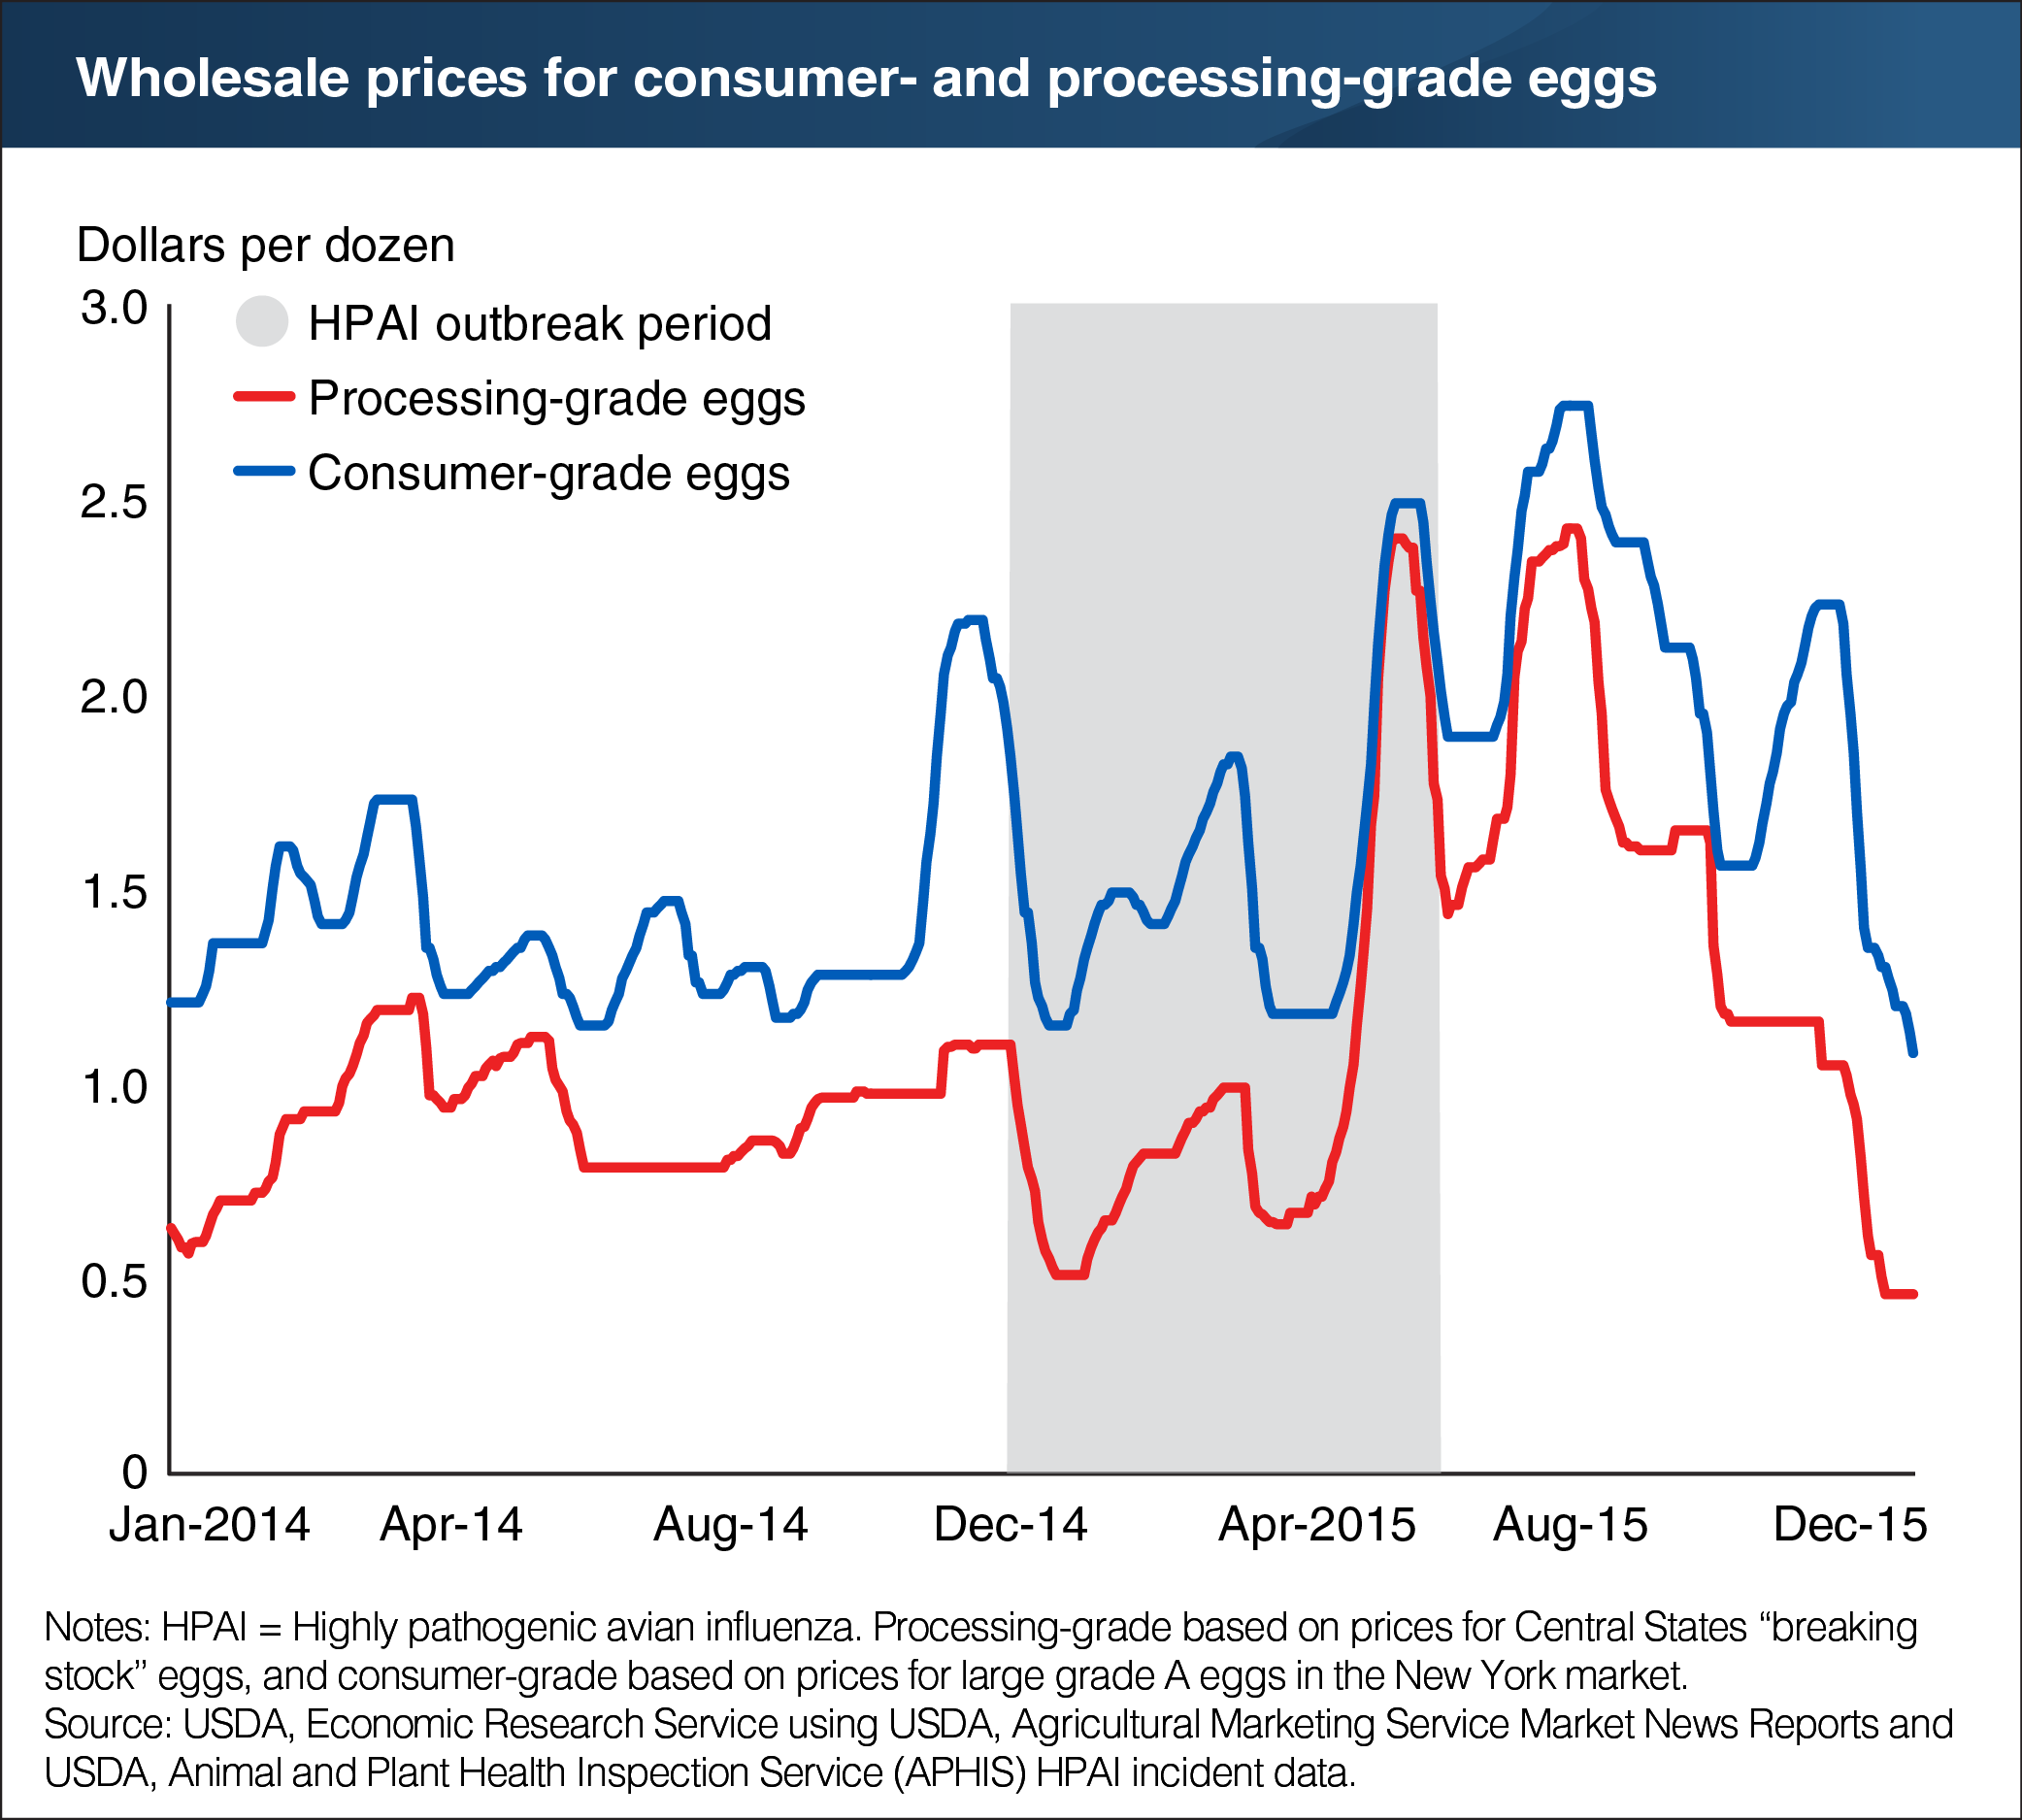
Egg prices rose and remained high during and after the 2014-15 U.S. highly pathogenic avian influenza outbreak

April 9
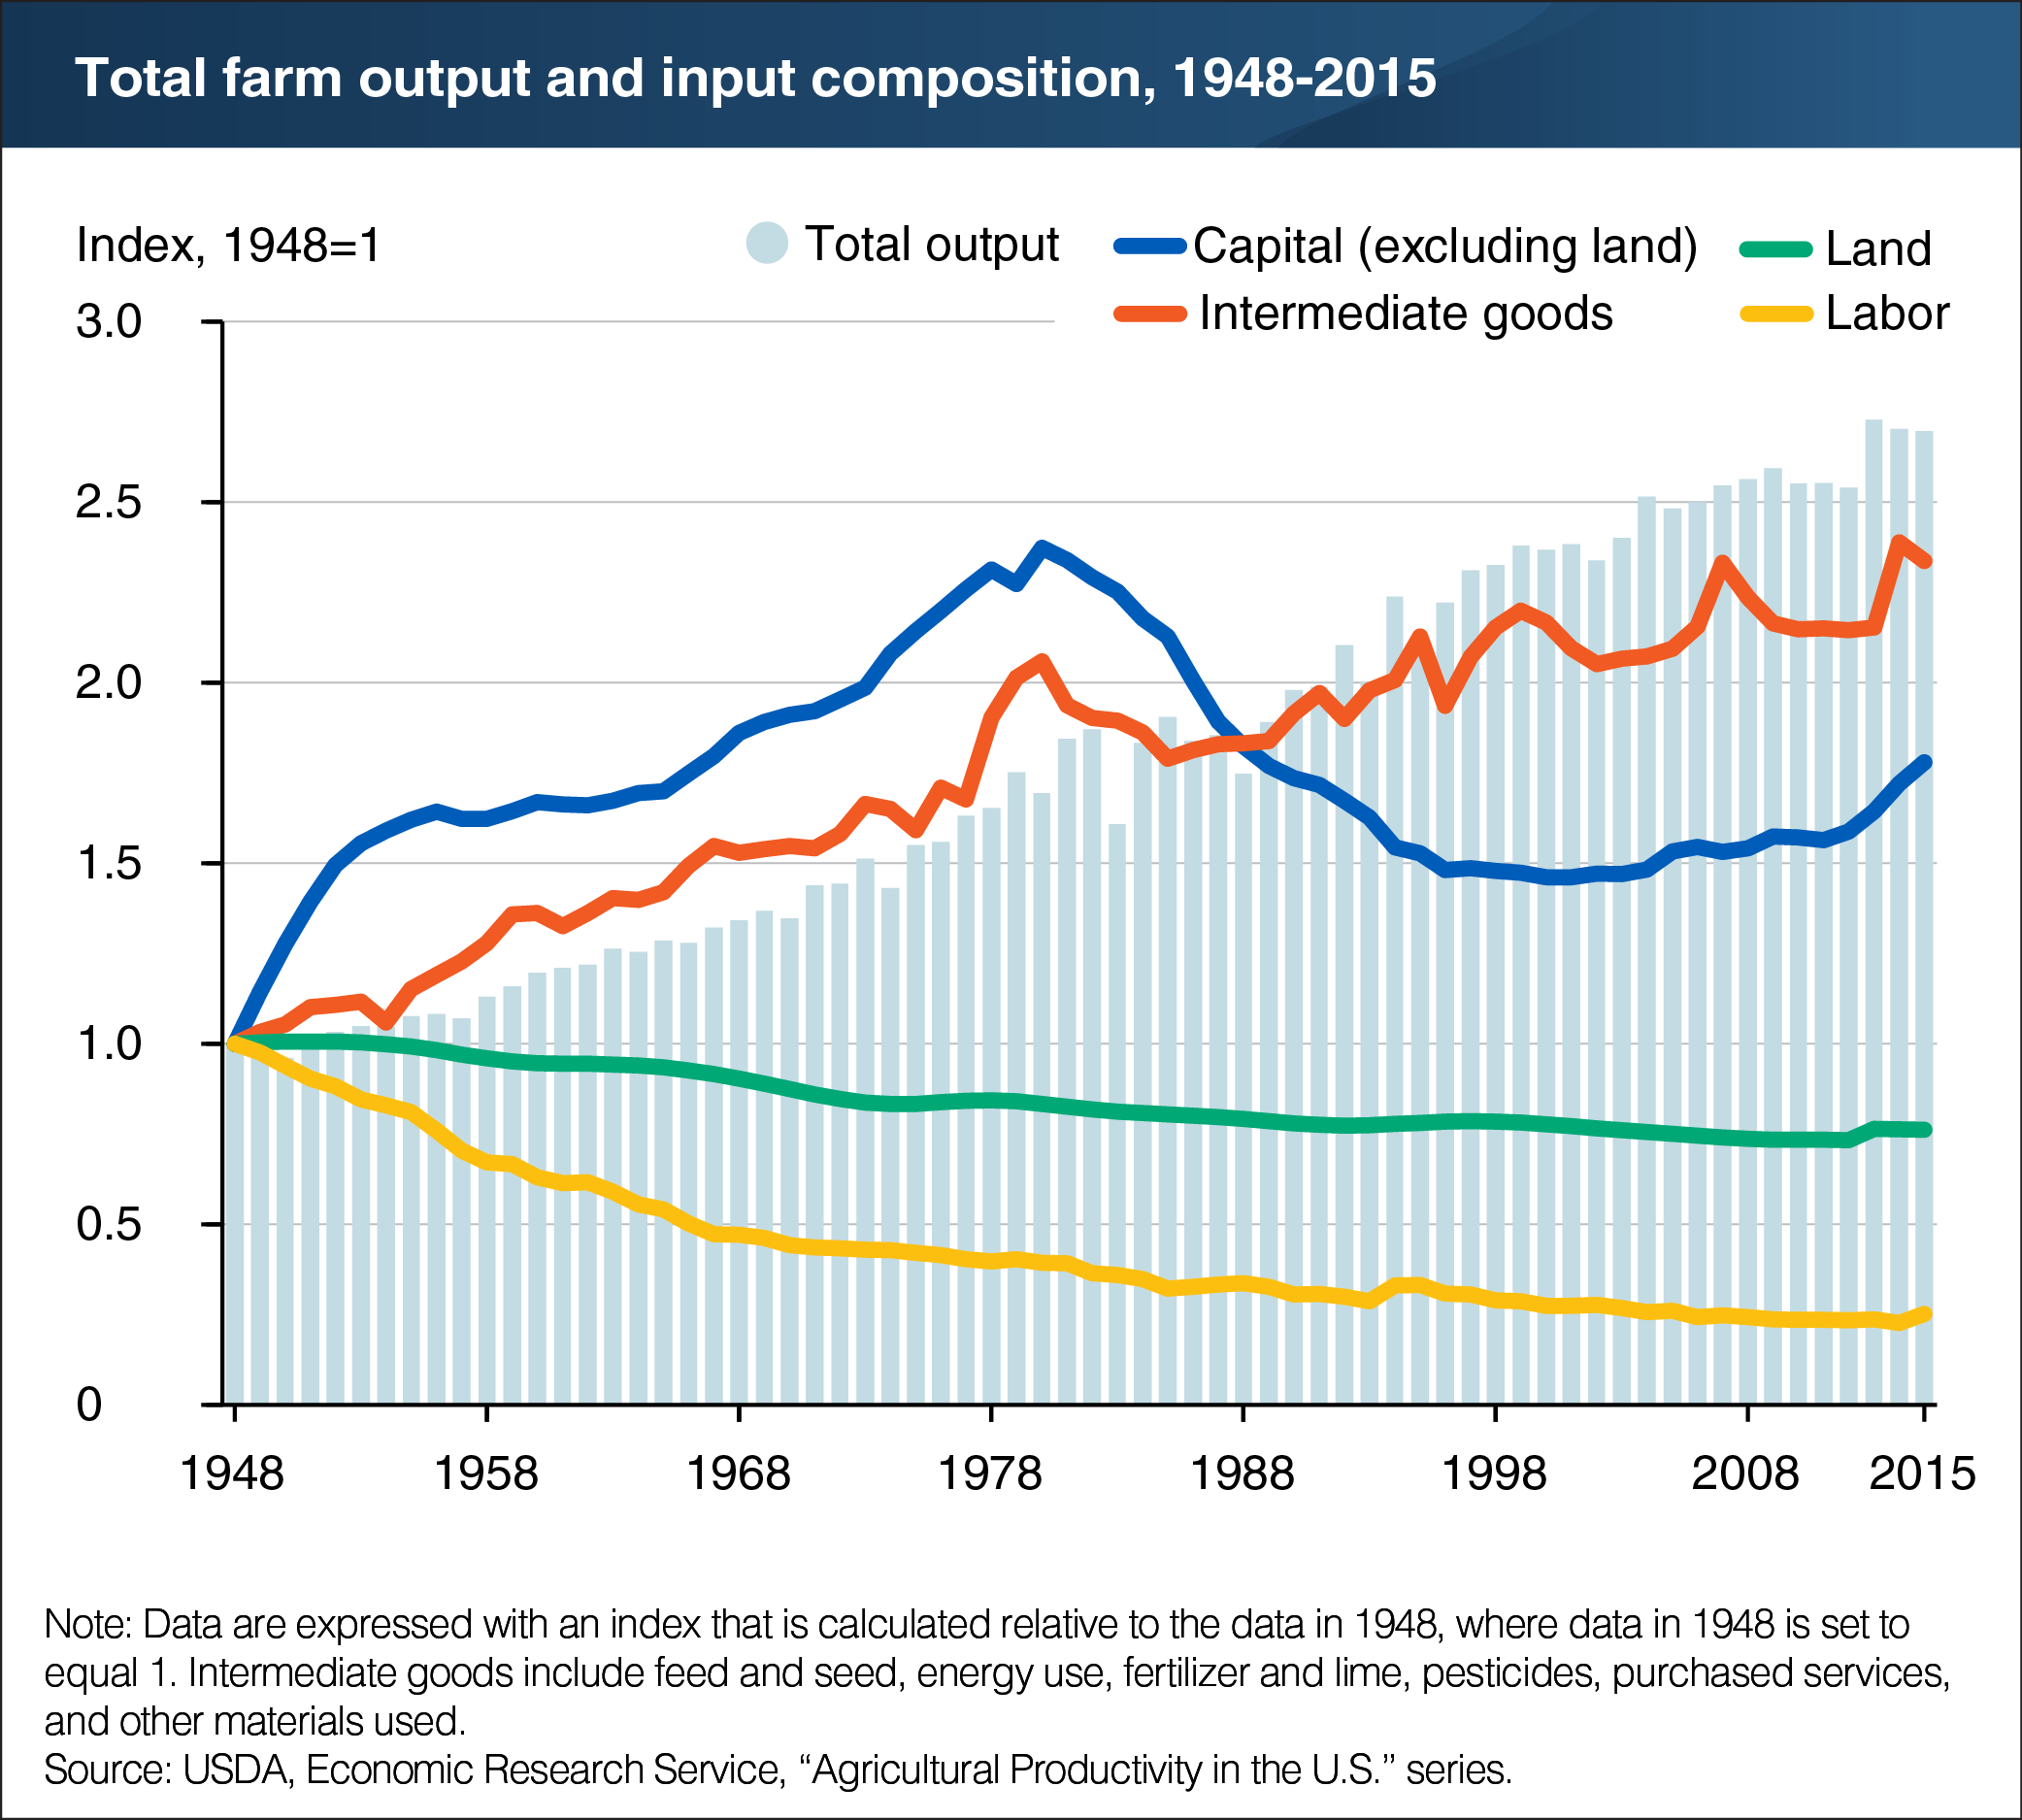
Farm inputs have shifted over time toward less use of labor and land, and more use of capital and intermediate goods

That's just this week!
Charts of Note homepageLike a tapas platter for your brain.