Our off-the-cuff-answer is on the start of the second decline from an all time high, something along these lines from StockCharts back in 2011:
Revisiting the 2007 S&P 500 Reversal
Although no two market tops are the same, we can get an idea of what a major reversal looks like by examining past reversals. The 2007 top evolved over a 9 month period. There were clear support breaks at 1425 and 1375. RSI broke its bull zone (40 to 80) at the end of December 2007. The ensuing throwback rally retraced 50% and met resistance near broken support.

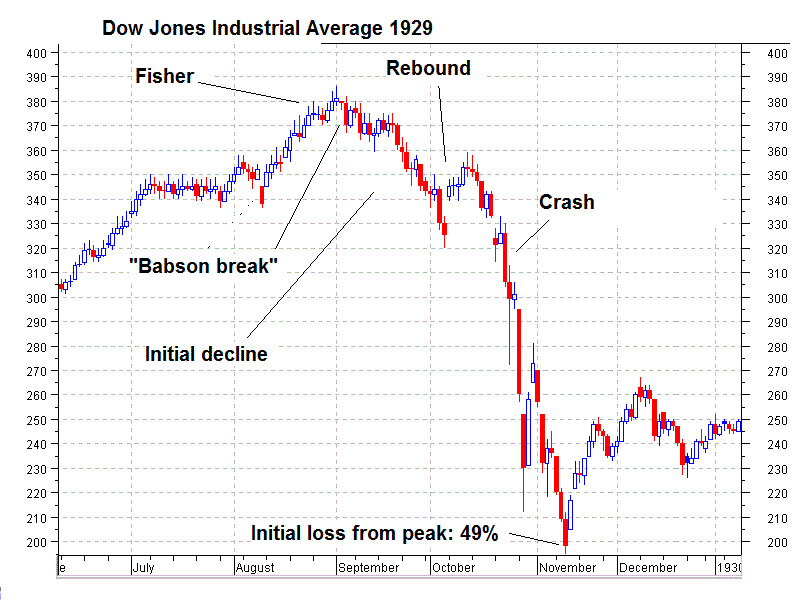
Here's another example via SNBCHF, the Dow Jones Industrial in 1929:

Do note this chart only takes you to the first week of 1930. The DJIA didn't bottom until July 8, 1932.At 41.22 (close, 40.56 intraday)
And today we see, via FinViz:
File under, things that make you say 'hmmm...'
Back tomorrow with the Rule 80B circuit breaker levels should we experience a waterfall decline.