The Department of Energy's Energy Information Administration (EIA) monthly data on volume sales is several weeks old when it released. The latest numbers, through mid-January, are now available. However, despite the lag, this report offers an interesting perspective on fascinating aspects of the US economy. Gasoline prices and increases in fuel efficiency are important factors, but there are also some significant demographic and cultural dynamics in this data series.
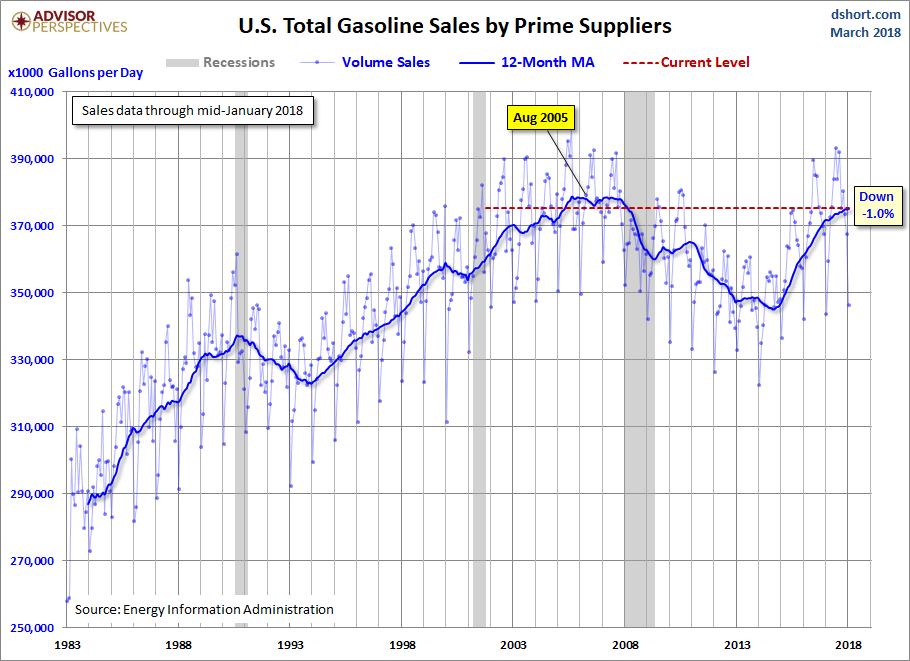
Because the sales data are highly volatile with some obvious seasonality, we've added a 12-month moving average (MA) to give a clearer indication of the long-term trends. The latest 12-month MA is 1.0% below its all-time high set in August 2005 and well off its -8.9% interim low set in August 2014.
The next chart includes an overlay of real monthly retail gasoline prices, all grades and formulations, adjusted for inflation using the Consumer Price Index (the red line). We've shortened the timeline to start with EIA price series, which dates from August 1990. The retail prices are updated weekly, so the price series is the more current of the two.

...MUCH MORE