In the early years of the 2010's Doug Kass was getting on every TV show he could find to pitch his contention that bonds were the "Short of the Decade". It got so bad that the usually peaceable LearnBonds put up a post in August 2012 titled "Doug Kass and the WORST Trade of the Decade" with a picture of Kass' chosen vehicle that was worth a thousand words:

It is difficult to be so wrong for so long. And he never fessed up.
Mr. Kass kept it up until late 2016. It got so bad, the TBT (UltraShort Lehman 20+ Yr. ETF) fell so far that the ETF sponsor, ProShares, had to do a 1:4 reverse split. In total the decline was roughly 300 to 33 last December 15th before heading up to this week's intermediate-term high.
$38.72 last.
Good times.
Anyhoo, here's the latest from Risk Reversal:
I am listening to a great discussion on CNBC between the Halftime Report’s Host Scott Wapner and Doubline Capital’s Jeffrey Gundlach, watch here:...
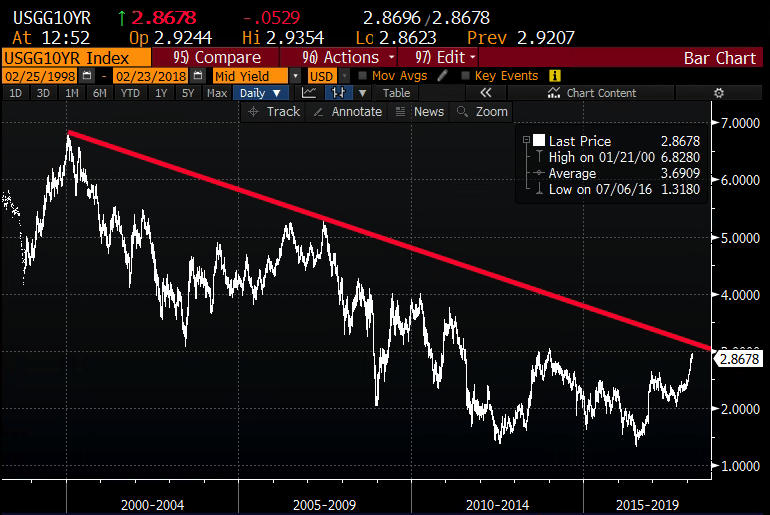
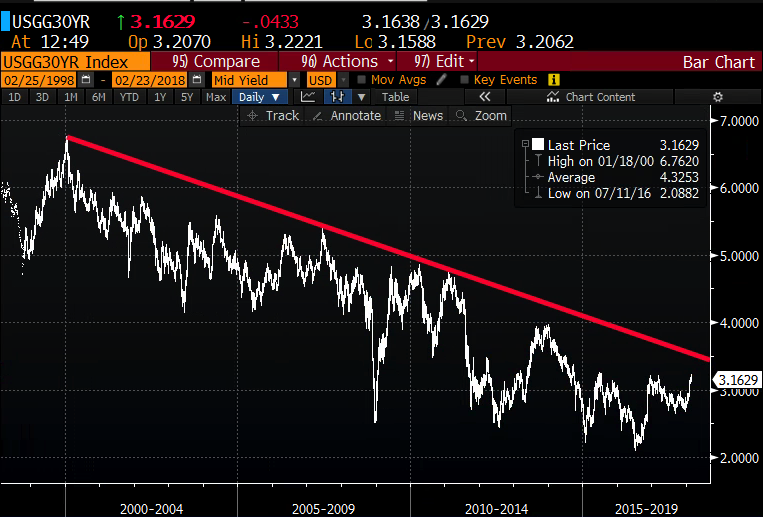
... Jeffrey, nick-named the Bond King has been calling for higher Treasury yields, weaker dollar and high commodity prices for months, and he’s obviously been right.Gundlach made a pretty important point for those who like to look at charts, that 10year US Treasury yield has broken the long-term downtrend, and that he has a low conviction view that rates continue to go higher, but this is also a matter of how you connect the dots.Here is a 20-year chart of the 10yr and the 30yr Treasury yields, connecting the peaks over that period.To my eye it shows both very near long-term resistance:
10yr yield
30yr yield
For the last ten or so years, it has been a take it to the bank trade to buy US Treasury Bonds when the yield has approached the downtrend. Now I get it, that was in a QE & ZIRP regime, both which have ended, with the Fed now embarking on QT, but the near precision of the double bottom in the one year chart of the TLT, the Ishares 20 year treasury bond etf is a sight to behold:...MUCH MORE
Here's our intro to October 2012's, "Money Management: Doug Kass Pounds the Table on His Leveraged Short Treasuries Trade (TLT; TBT)"
One of these days we'll reprise Mr. Kass' Adventures in Tesla Shorts.The long bond ETF, TLT is up a few cents at $124 even.
The double short TBT is off a few cent at $15.55. Compare with chart below.
Most everyone who pays attention to this stuff know that some day treasuries will mean-revert and trade lower.
What most everyone isn't doing is publicly recommending the trade and using double leveraged inverse ETF's to do it.
There's a lesson in here somewhere....