With a sense of urgency. No more dilly-dallying around.
The Fed’s balance sheet for the week ending January 31, released this afternoon, completes the fourth month of QE-unwind. And it’s starting to be a doozie.
This “balance sheet normalization” impacts two types of assets: Treasury securities and mortgage backed securities (MBS) that the Fed acquired during the years of QE and maintained afterwards.
The Fed’s plan, as announced in September, is to shrink the balances of Treasuries and MBS by up to $10 billion per month in October, November, and December 2017, then to accelerate the pace every three months. In January, February, and March 2018, the unwind would be capped at $20 billion a month; in Q2, at $30 billion a month; in Q3, at $40 billion a month; and starting in Q4, at $50 billion a month.
According to this plan, balances of Treasuries and MBS will shrink by $420 billion in 2018, by an additional $600 billion in 2019, and by additional $600 every year going forward until the Fed deems the level of its holdings “normal.” Whatever this level may turn out to be, it will be much higher than the level suggested by the growth trajectory before the Financial Crisis.
For January, the plan called for shedding up to $20 billion: $12 billion in Treasuries and $8 billion in MBS.
So how did it go?
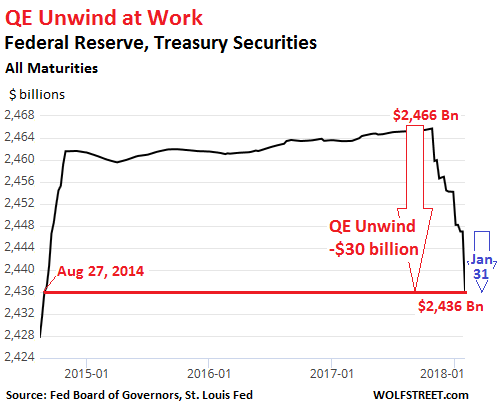
On its December 27 balance sheet, the Fed had $2,454 billion of Treasuries. By January 31, it had $2,436 billion: a drop of $18 billion in one month!
This exceeds the planned drop of $12 billion for January. But hey, over the holidays, most folks at the New York Fed, which does the balance sheet operations, were probably off and not much happened. And so this may have been a catch-up action, with a sense of urgency.
In total, since the beginning of the QE Unwind, the balance of Treasuries has plunged by $30 billion, to hit the lowest since August 27, 2014. This part of the QE Unwind is happening:
The jagged down movement in the chart is a result of the way the Fed unwinds its QE. It does not sell the securities. It allows them to “roll off” its balance sheet. It works this way:......MORE