1) The Biotechs are approaching escape velocity:
Presenting the XBI Biotech ETF. And since this time is different, no commentary is necessary.
-via ZeroHedge, Mar 20, 2015
2) A bad memory from 15 years ago, link below.
From Dana Lyons' Tumblr:
Signs of Froth in the Biotech Sector
There is a fervent debate in some financial circles regarding the existence — or non-existence — of a biotech bubble. It is a challenging, and perhaps pointless, debate given the subjectivity surrounding the word “bubble”. It brings to mind the famous quote by United States Supreme Court Justice Potter Stewart when attempting to define pornography: “perhaps I could never succeed in intelligibly [defining pornograph]. But I know it when I see it.” So it is with bubbles. They are especially easy to see after the fact. But in the midst of a bubble, the hysteria surrounding its inflation of prices is so intense that it is easy for folks to get caught up in it. That’s what allows the bubble to develop.
So where do we fall in the biotech bubble debate? We would side with the “yes, it is a bubble” camp. Understand that we do not use that term loosely either. In our view, bubble claims are thrown around far too often. Not every sharp increase in asset prices is a bubble. Most are simply part of the cyclical pattern of ups and downs that takes place in any market-based pricing structure. True bubbles are a product of human nature manifested in manic behavior and parabolic price increases.
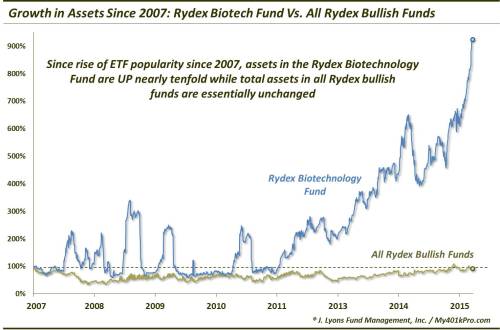
One possible example of this mania is evident in our Chart Of The Day. We have discussed the topic of assets in Rydex Mutual Funds on several occasions. As Rydex Funds are geared toward active traders (or at least non-buy & hold investors), the level of assets in their funds, either as a whole or in an individual fund, can be useful as a gauge of sentiment. Although, with the rising popularity of ETF’s, the Rydex Funds have generally seen a slump in their assets, especially relative to ETF’s. As this chart shows, however, that has NOT been the case with the Rydex Biotechnology Fund.

As we mentioned, ETF’s have taken substantial market share from active mutual funds since their emergence on the scene. Most Rydex funds have a fraction of the assets they had around the turn of the century. Since the popularity of ETF’s really started to accelerate around 2007, we began this chart with the end of that year. Since that time, the total assets in Rydex’ “bullish”-oriented index funds (shown by the beige line) is essentially flat. Although, during almost that entire period, total bull assets were well below 2007 levels. Just recently, after the S&P 500 had risen roughly 35% above its 2007 highs, assets have finally reached their 2007 levels again.And the memory? A year-and-a-day after the 2009 market bottom we posted "Happy Anniversary Mr. Market: Ten Years Ago Today...":
The Biotech Fund, however, is a different story. Since 2007, assets in the fund have increased from around $58 million to $567 million as of Friday, a nearly ten-fold increase in assets. And in fact, the entire sustained gain has come just since late 2011 when the biotech run really began to accelerate. ...MORE
...Internet.com put out this press release:
The Nasdaq closed that Friday at 5048.62, it's all-time high.INTERNET.COM'S ISDEX, THE INTERNET STOCK INDEX, BREAKS 1,000, A GAIN OF 1000% IN LESS THAN FOUR YEARS
(New York, NY-March 10, 2000)-internet.com Corporation's (Nasdaq: INTM) ISDEX(r), the Internet Stock Index (http://www.isdex.com), rose above 1,000 for the first time last week. Since its inception in 1996, ISDEX has posted a 1,012% gain, outpacing the Dow and S&P 500, which have only increased 104% and 120%, respectively, during the same period. The ISDEX has also outpaced these indices for this year, with the ISDEX up 29% and both the Dow and S&P down 13% and 5%, respectively."With a gain of more than 29% since January 1 alone, it is clear that Internet stocks continue as one of the overall economy's strongest sectors," said Alan M. Meckler, chairman and CEO of internet.com Corporation....
On the following Monday the Naz was down 141 points. Tuesday, 200.
The index had begun a 30-month decline to it's September 24, 2002 intra-day low of 1,169.04, down 77%.
This became one of my favorite songs:...MORE
