Brent $82.84 down 2.13%, WTI $76.77 down 2.55%; XLE $83.99 down 2.38%.
First up, CNBC:
Oil majors: Is the four-year low priced in?
Brent crude oil fell to its lowest in over four years on Tuesday as Saudi Arabia cut its selling price to U.S. buyers in an apparent attempt to hang onto to its share of the world's largest market.And from See It Market, Nov. 3:
Brent crude futures fell below $82.50, levels not seen since October 2010 following a 25 percent price fall since June this year and oil majors have not been immune to the slide.
European energy giants BP and Total are both down over 10 percent in the last six months, Royal Dutch Shell has fallen over 8 percent and U.S. groups Exxon Mobil and Chevron are both down around 6 percent lower over the same period.
But the precipitous descent of the oil price in recent weeks has not pushed energy shares to new lows, as much of the damage of Brent's decline "has already been done" according to asset managers.
"Despite the sharp tumble in the price of oil, we believe there are a number of companies not only hedged against the recent fall in the oil price, but also in a position to benefit from M&A or strengthening credit ratings," fund managers at Kames Capital Phil Milburn and Claire McGuckin said....MORE
There Will Be Blood: Will Energy Or Crude Oil Blink First?
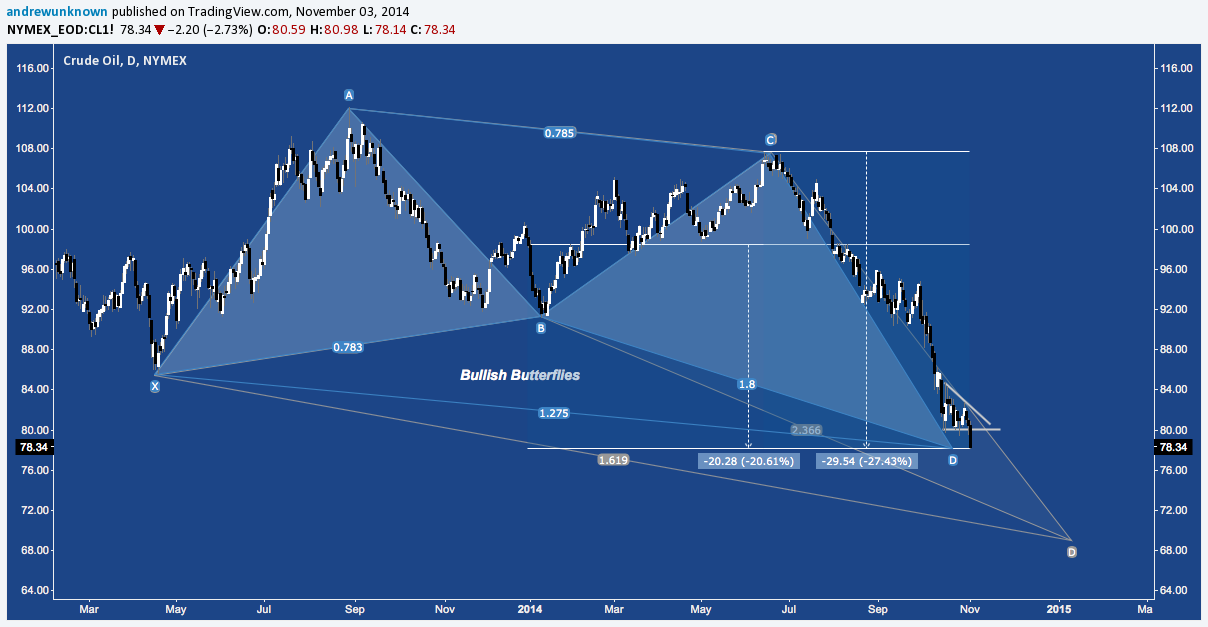
Despite the ever-present assurances to the contrary from Developed Market equities over the last few weeks, there’s always a bear market somewhere. Look no further than Light Sweet Crude Oil (CL), off another -2.75% today, ostensibly due to Saudi Price Cuts intended to increase competitiveness versus US Shale. That brings Crude’s slippery slope (cliff dive?) to -27.43% since it’s June high at $107.68/bbl and to -20.61% YTD.
Crude Oil spilled out of the Descending Triangle it’s been winding through since the mid-October lows, violently snapping the $80 handle it’s been leaning against to push into the first of two 1.5-Year Bullish Butterfly Potential Reversal Zones (PRZ) near $78/bbl. The second PRZ? At $68.50/bbl.
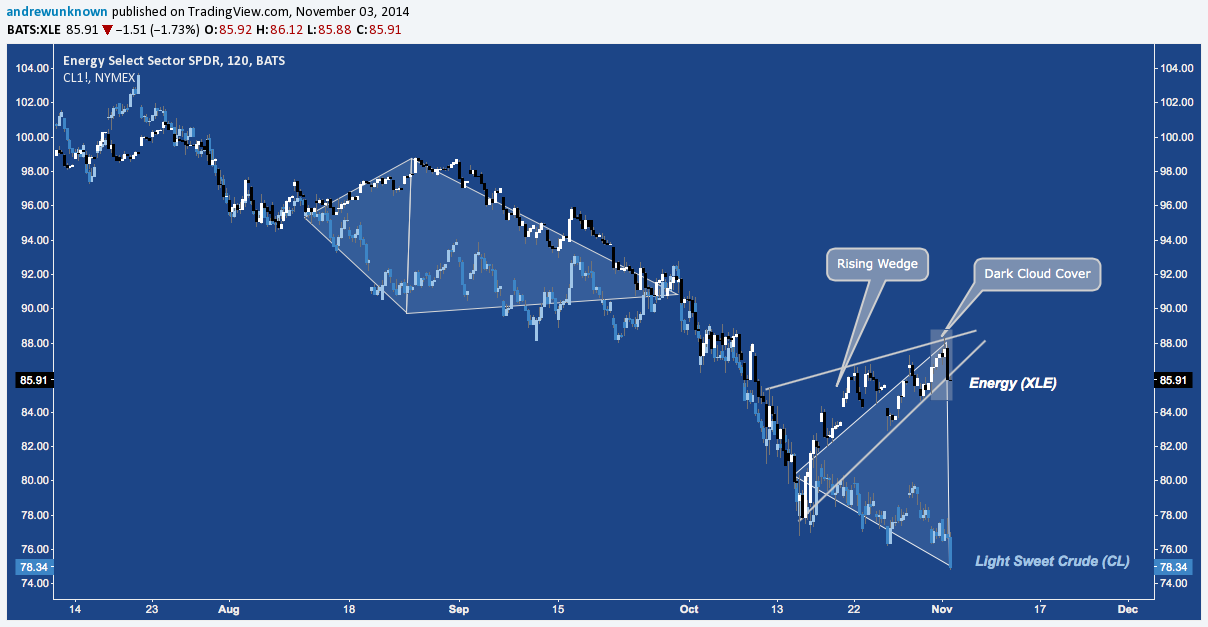
The Energy Select Sector SPDR (XLE) had a good day, by comparison, but still finished off almost -1.7% to close near $86. Here’s the ETF winding out a Rising Wedge (check out Bulkowski’s data on Rising Wedges here) posting a Dark Cloud Cover candlestick pattern (Bulkowski on DCCs here) that almost entirely negated Friday’s advance:
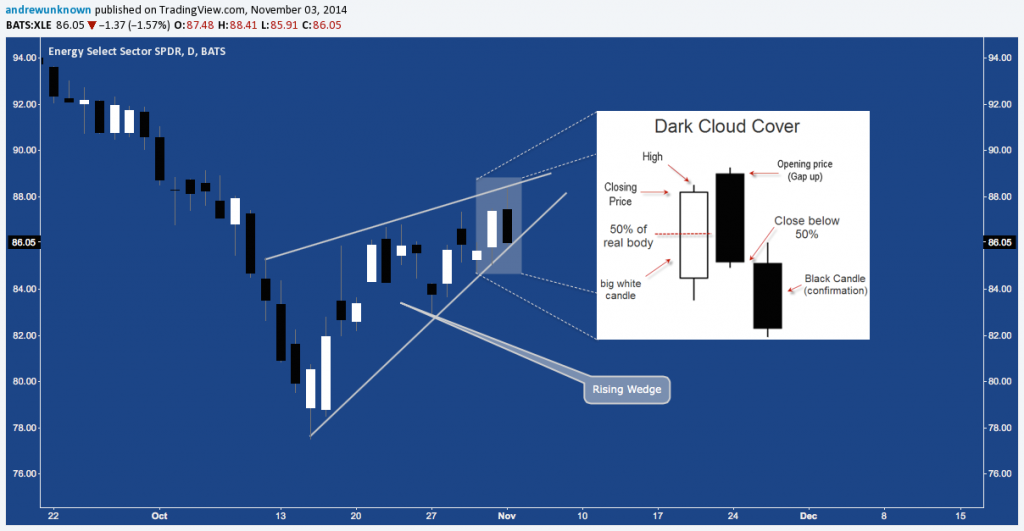
That performance comes just as XLE pushes to the Rising Wedge apex at fibonacci cluster resistance between $86.50-$88 and shortly after completing a Death Cross (which, incidentally, has been followed by a net gain). Looking at the 50-Day and 200-Day SMAs that create this technical event, we can see the 50-Day is about to shed the remainder of late August’s bear flag, while the 200-Day is about to get rid of January’s correction before it starts working off February-June’s massive run. All told, this suggests the 50-Day isn’t likely to re-cross the 200-Day to the upside in the short-term....MORE
All of which begs the question: will XLE break higher to extend it’s divergence from CL?
Other than the fact it doesn't 'beg' the question but rather, raises it,this post is right on the money.