From Afraid to Trade:
Planning the Next Swing in the SP500 from Color Structure Chart
Let’s start our week with a simple “Color Structure” Chart of the S&P 500 and use it to plan a price pathway for the week.
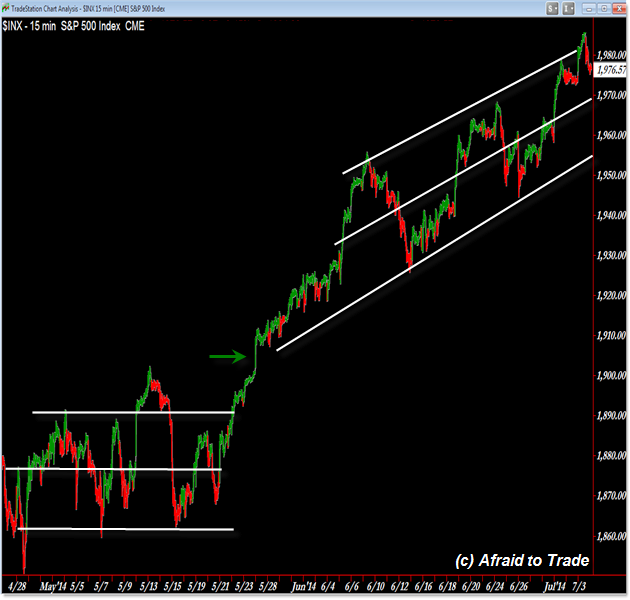
We’ll start with the current intraday structure chart to set the stage:

The color structure chart shows a sideways rectangle (early May) which is a consolidation pattern and then the recent breakout above the 1,900 level that fueled the breakout and uptrending channel that took place through June (and now into July).
The main idea is that price tends to trade within trendline boundaries and we see a rising parallel trendline channel building the ’structure’ for the current market.
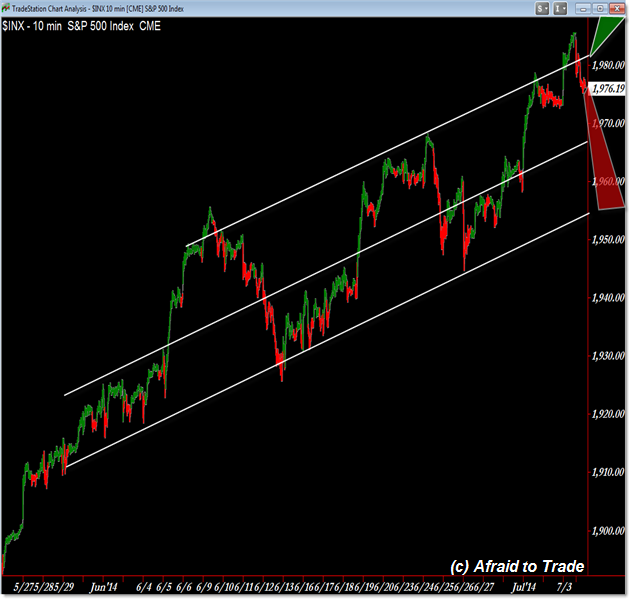
Let’s zoom down to a closer perspective to plan our two price pathways to trade the next price swing:

If the structure continues, then we’ll simply expect price to swing down away from the 1,980 level at least toward the 1,970 Midpoint and then likely down to the lower rising trendline target which will soon intersect 1,960......MORE