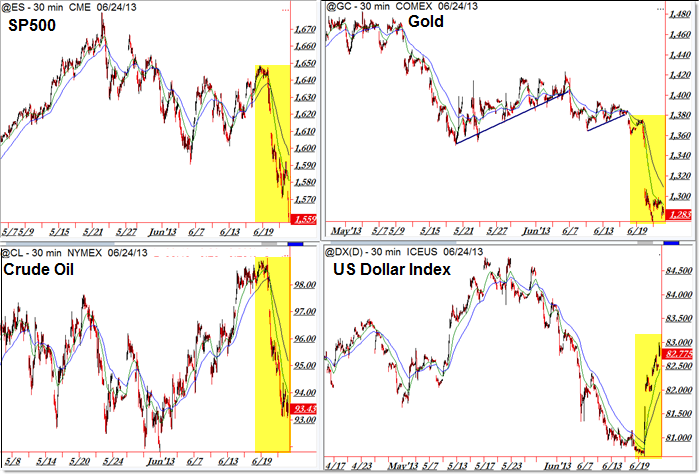
We have a rare situation this morning where the entire "candle" (day's range) of the S&P 500 is below the lower bollinger band. I can't find another situation exactly like it in the past few years, but there were 2 episodes in August and October 2011 where the majority of the candle was below; both led to decent 3-6 day type of bounces.
Just over a month ago we were talking about historical overbought conditions on the weekly and monthly charts - what a sea change.A reasonable target would be the gap from June 19th 1624.63-1628.93 or around sixty points up from here.
(via Afraid to Trade):

S&P 1564.29, daily low 1560.61; DJIA 14601, daily low 14,551.27.
