I don't have time to go into a lot of detail right now, maybe next week. The current overcapacity in P&C, which has led to a bit of a price war, will be ending soon, maybe three to six weeks.The follow-up on August 7, 2008:
A back of the envelope calculation says insurers would be mis-pricing weather risk vs. "average" conditions.
The recent flip of the Pacific Decadal Oscillation to it's cold phase will, if past history repeats, lead to higher insured losses in everything from hail damage to landfalling hurricanes.
"Your Climateer Early Warning System: Insurance (AIG; ALL; CB; HIG; TRV) "
...That was a month before the June 12 Iowa floods.Even better than having subsequent reports practically parrot your prediction's phrasing is the fact that getting on the right side of the trade made it easier to position for the disaster that followed (e.g. AIG down 97%, HIG down 80%).
Since then we've had these headlines (all from Bloomberg):
July 22
Natural Disasters In U.S. Cost Insurers $6 Billion In Quarter
July 23
Allstate Profit Falls on Tornadoes, Investment Loss
July 24
Chubb Earnings Decline on Natural Disaster Costs
July 28
United Fire Falls Most in Seven Years on Catastrophes
The price war we were referencing has lasted longer than we expected three months ago. Research Recap had some commentary on insurance pricing last week:US Home Insurers Set to Report Underwriting Loss This YearThe US homeowners insurance industry will report a modest underwriting loss in 2008 as rates fall due to excess capacity, an abundance of reinsurance options as well as regulatory and political pressures, Fitch Ratings says. In a new report on the industry, Fitch notes that although insurers have experienced improved underwriting results over the past six years, market fundamentals have deteriorated recently.We'll come back to this over the next few months. For now, use the "Search Blog" box, keyword Pacific Decadal Oscillation or PDO.The industry failed to produce an underwriting profit for 15 years prior to 2003. Fitch believes that poor underwriting results in the homeowners business originated from the line serving more as a “loss leader” to attract automobile insurance business for many insurers. Other explanations for underperformance include artificially low prices to increase market share and a lack of sophistication regarding catastrophe management....MORE
The contrarian bet idea came out of the recent Colorado State and WSI forecasts for an active hurricane season in 2009 combined with the uncritical attention paid to Munich Re's world catastrophe report on Monday (to my jaundiced eye it seemed written to maximize property/casualty premiums).
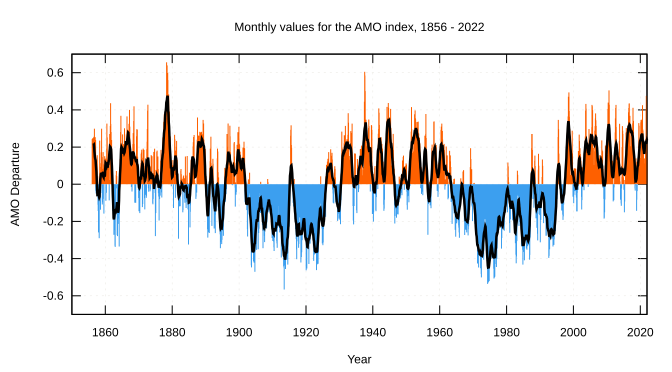
Although there are big gaps in our knowledge base and plenty of room for disagreement among the tropical cyclone cognesceti, there is a correlation between the Atlantic Multidecadal Oscillation and Atlantic basin hurricanes. According to the National Oceanic and Atmospheric Administration:
...How important is the AMO when it comes to hurricanes - in other words - is it one of the biggest drivers? Or Just a minor player?The AMO tends to stay in predominantly the cool or warm phase for extended periods but the temperature anomaly does does change from month to month:
During warm phases of the AMO, the numbers of tropical storms that mature into severe hurricanes is much greater than during cool phases, at least twice as many. Since the AMO switched to its warm phase around 1995, severe hurricanes have become much more frequent and this has led to a crisis in the insurance industry.Does the AMO influence the intensity or the frequency of hurricanes (which)?
The frequency of weak-category storms - tropical storms and weak hurricanes - is not much affected by the AMO. However, the number of weak storms that mature into major hurricanes is noticeably increased. Thus, the intensity is affected, but, clearly, the frequency of major hurricanes is also affected. In that sense, it is difficult to discriminate between frequency and intensity and the distinction becomes somewhat meaningless....
Here's the monthly table showing July-Dec (Dec. will be reported in a couple weeks) and what might be a developing short-term cooling:
2008 0.261 0.226 0.252 0.154 0.055 -99.990
Should the insurers get higher prices and the season turn out to be average or below, it will be they, rather than the hurricanes, making a killing.
Stay tuned
