Showing posts sorted by date for query roy spencer. Sort by relevance Show all posts

Monday, August 4, 2025

We Won Our (Hypothetical) Global Satellite-Inferred Lower Tropospheric Temperature Anomaly Prop Bet

Say that fast three times. 

From Dr. Roy Spencer at the University of Alabama - Huntsville, August 2:

UAH v6.1 Global Temperature Update for July, 2025: +0.36 deg. C 

The Version 6.1 global average lower tropospheric temperature (LT) anomaly for July, 2025 was +0.36 deg. C departure from the 1991-2020 mean, down from the June, 2025 anomaly of +0.48 deg. C. 
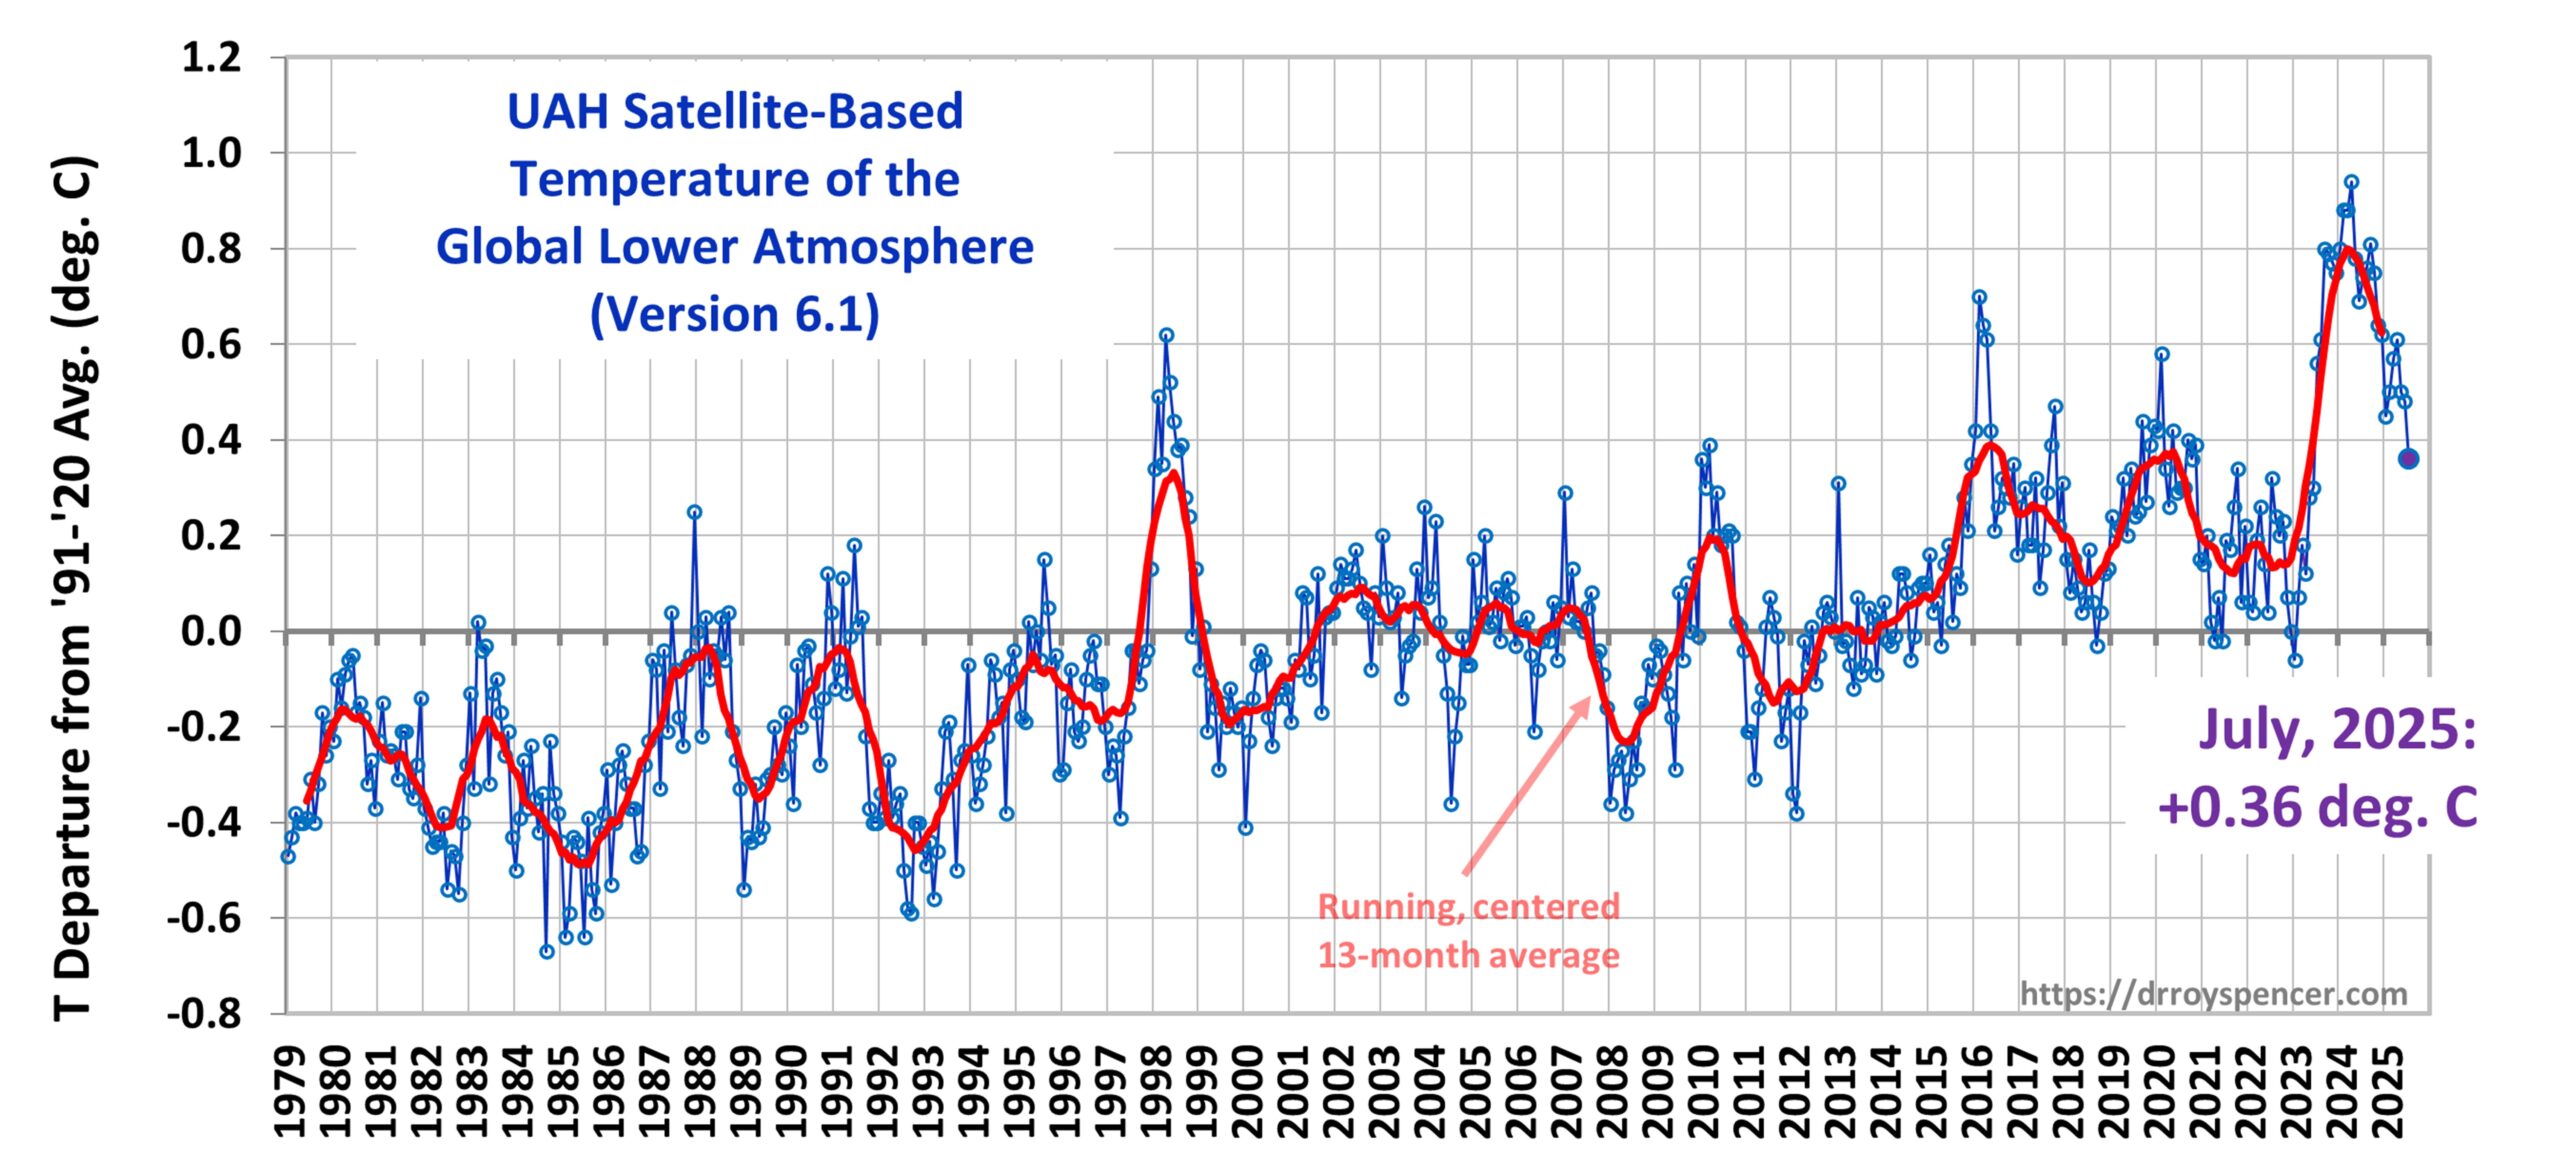
https://www.drroyspencer.com/wp-content/uploads/UAH_LT_1979_thru_July_2025_v6.1_20x9-scaled.jpg 

....MUCH MORE

The prop bet from May 2, 2024 was:

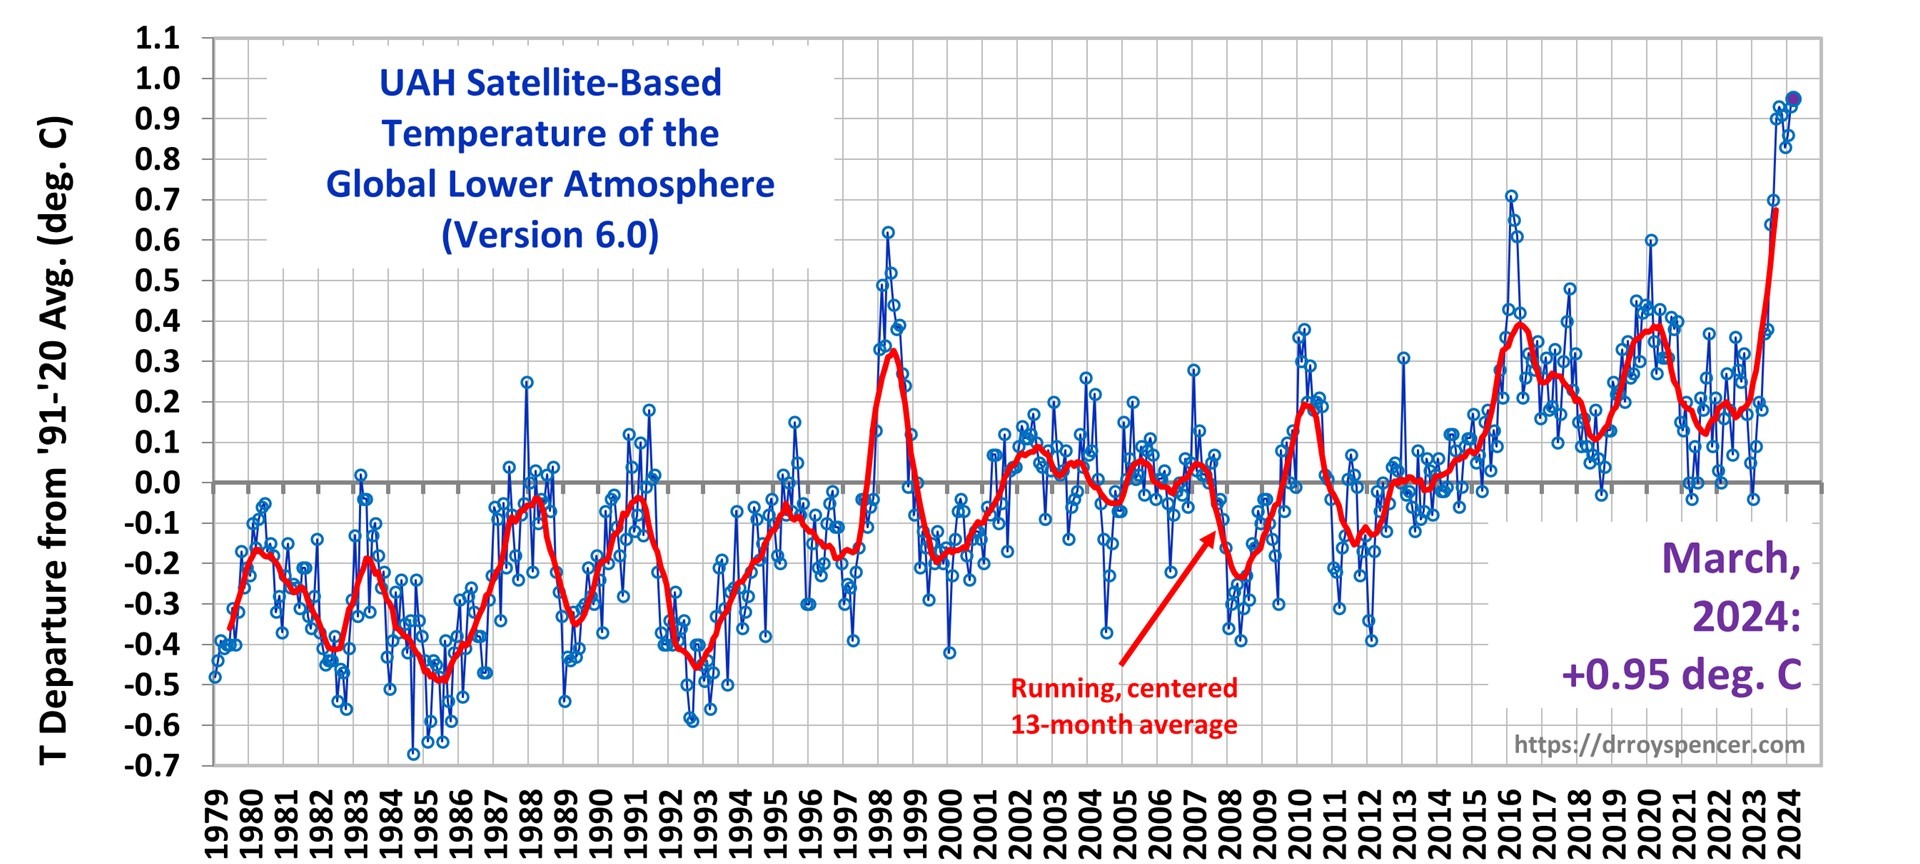
Here's a prop bet for you. By May 15, 2026 we will see the satellite-measured -inferred global lower atmospheric temperature anomaly decline by at least 1/2 degree C.

The two keepers of the satellite record are Remote Sensing Systems in Santa Rosa CA and the University of Alabama-Huntsville.... 
*****
...Again the baseline for the prop bet: the above "Latest Global Temp. Anomaly (March '24: +0.95°C)"....

Which was immediately (May 5, 2024) followed by:

UAH Global Temperature Update: April Sees New High Temperature Anomaly For The Satellite Era

Great, just effin' great. I had to go shooting my mouth off with a prop bet on May 2, couldn't wait for the new number to be released, no sirree, had to be posted when the memory to post it was triggered

If interested here is the saga of the prop bet (some day I'll explain the rationale behind it) including the low point, psychologically, on April 14, 2025:

Eleven days late getting to this, in part due to pain aversion* induced by getting so close to our prop-bet target, only to have victory snatched away with just 1/100 of a degree C to go....

The asterisk leads to:  *See "Adaptive behaviour and learning in slime moulds: the role of oscillations"

Tuesday, July 8, 2025

Satellite-Inferred Global Temperature Down Miniscule 2/100ths deg. C In June

From Dr. Roy Spencer at the University of Alabama-Huntsville, July 3:

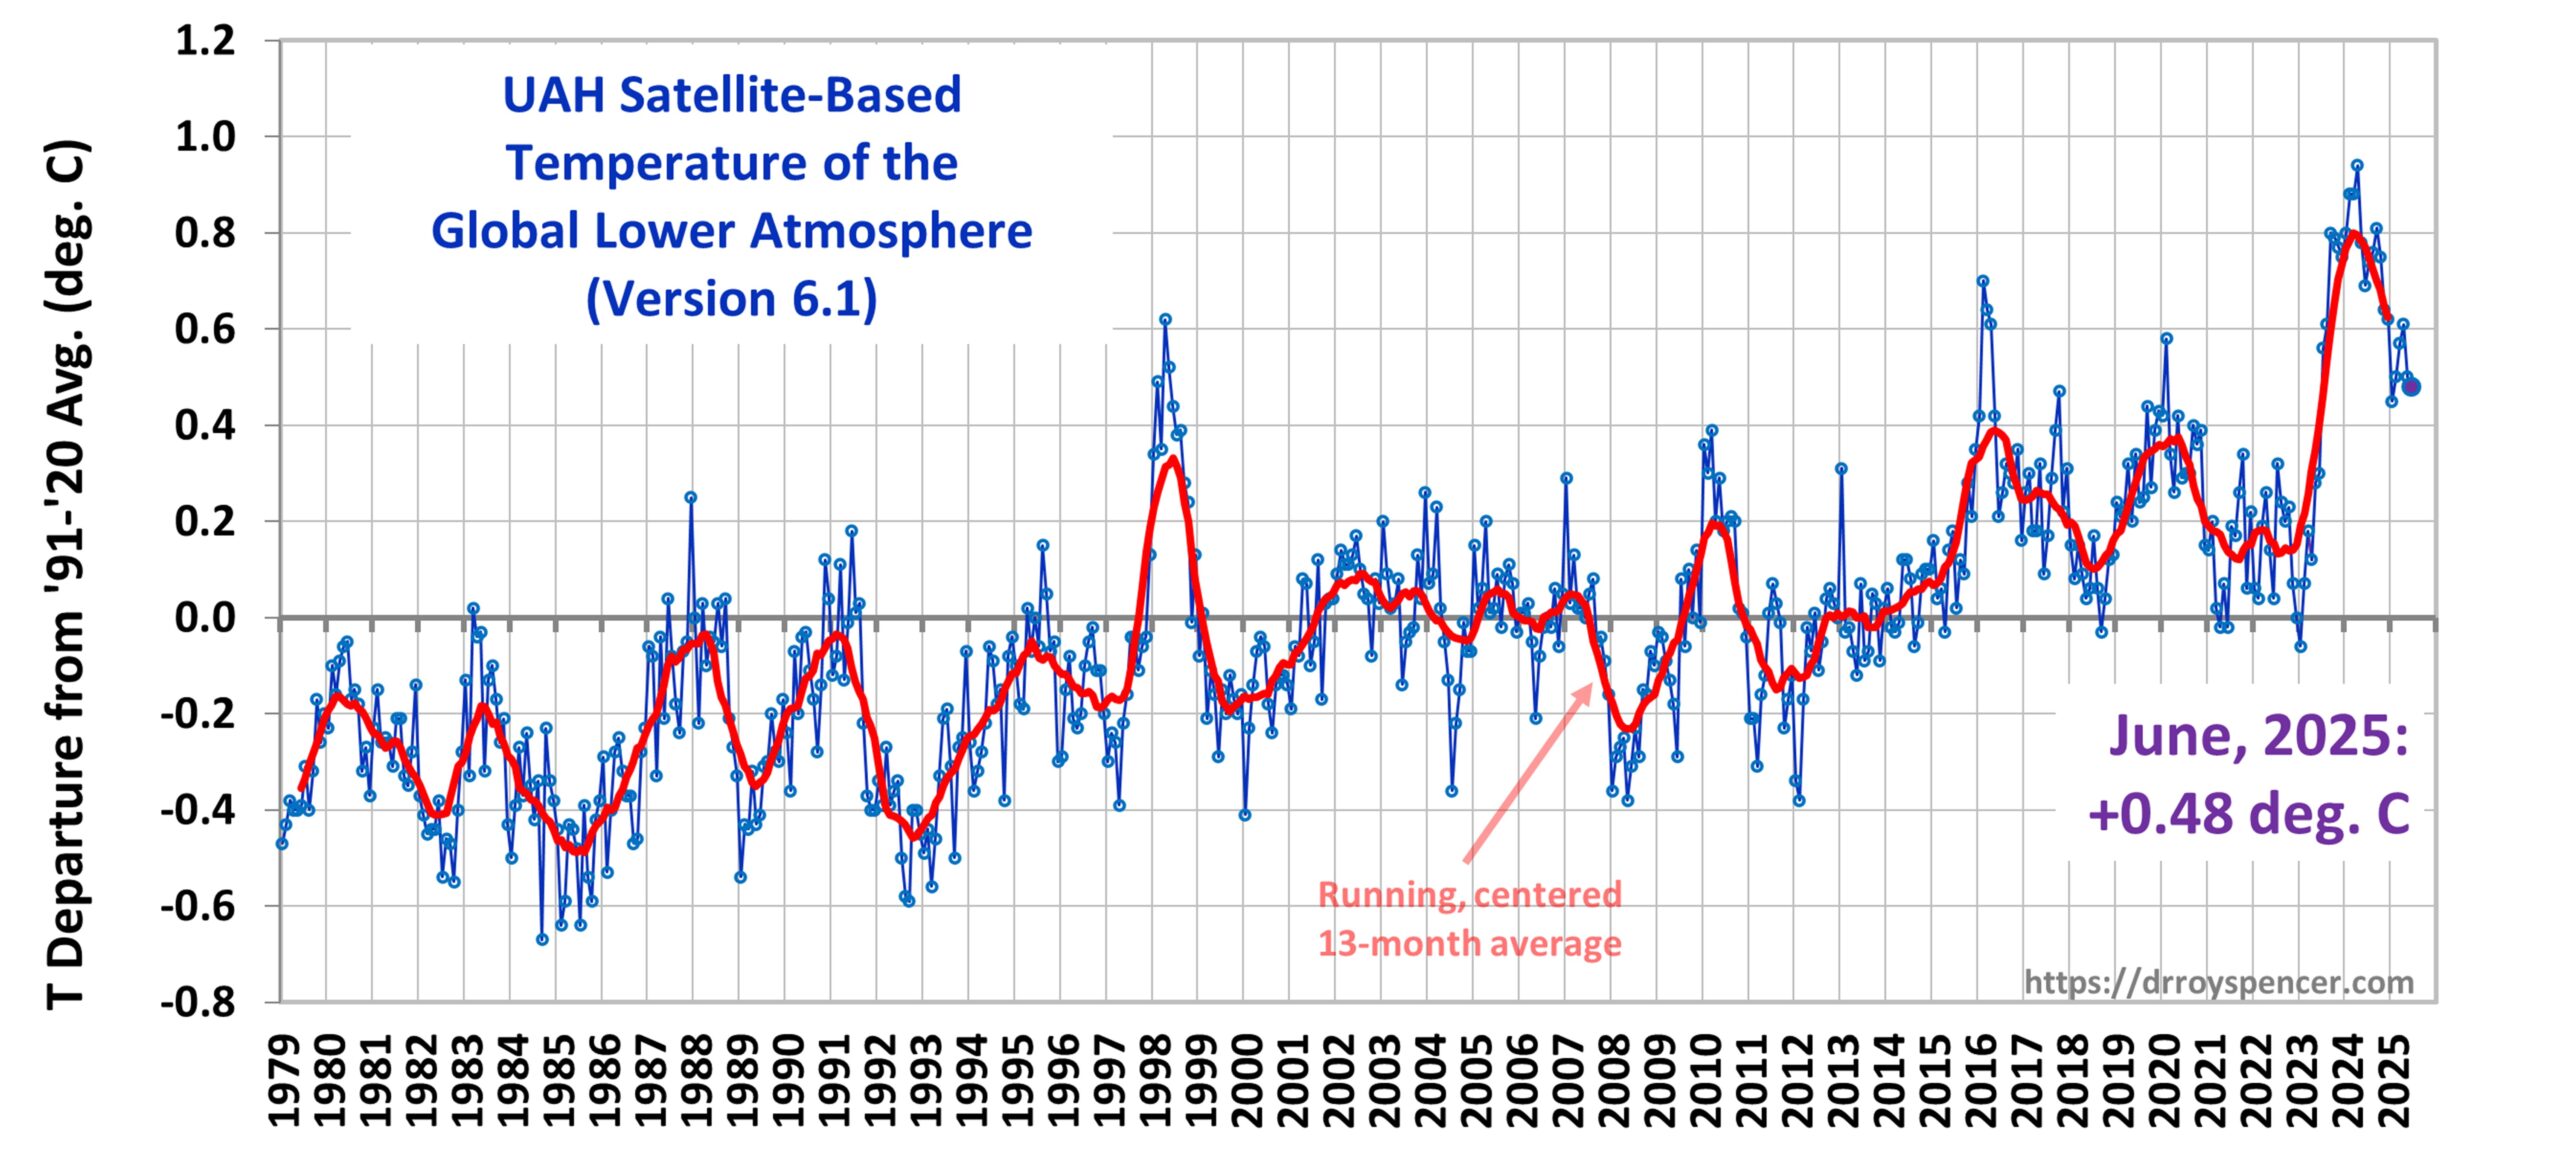
UAH v6.1 Global Temperature Update for June, 2025: +0.48 deg. C

The Version 6.1 global average lower tropospheric temperature (LT) anomaly for June, 2025 was +0.48 deg. C departure from the 1991-2020 mean, down slightly from the May, 2025 anomaly of +0.50 deg. C. 

https://www.drroyspencer.com/wp-content/uploads/UAH_LT_1979_thru_June_2025_v6.1_20x9-scaled.jpg 

The Version 6.1 global area-averaged linear temperature trend (January 1979 through June 2025) now stands at +0.16 deg/ C/decade (+0.22 C/decade over land, +0.13 C/decade over oceans).

The following table lists various regional Version 6.1 LT departures from the 30-year (1991-2020) average for the last 18 months (record highs are in red):....

....MUCH MORE 

Monday, April 14, 2025

Satellite-Inferred Global Temperature Anomaly Higher Again In March

Eleven days late getting to this, in part due to pain aversion* induced by getting so close to our prop-bet target, only to have victory snatched away with just 1/100 of a degree C to go. 

From the keeper of the record at the University of Alabama - Huntsville, Dr. Roy Spencer, April 3:

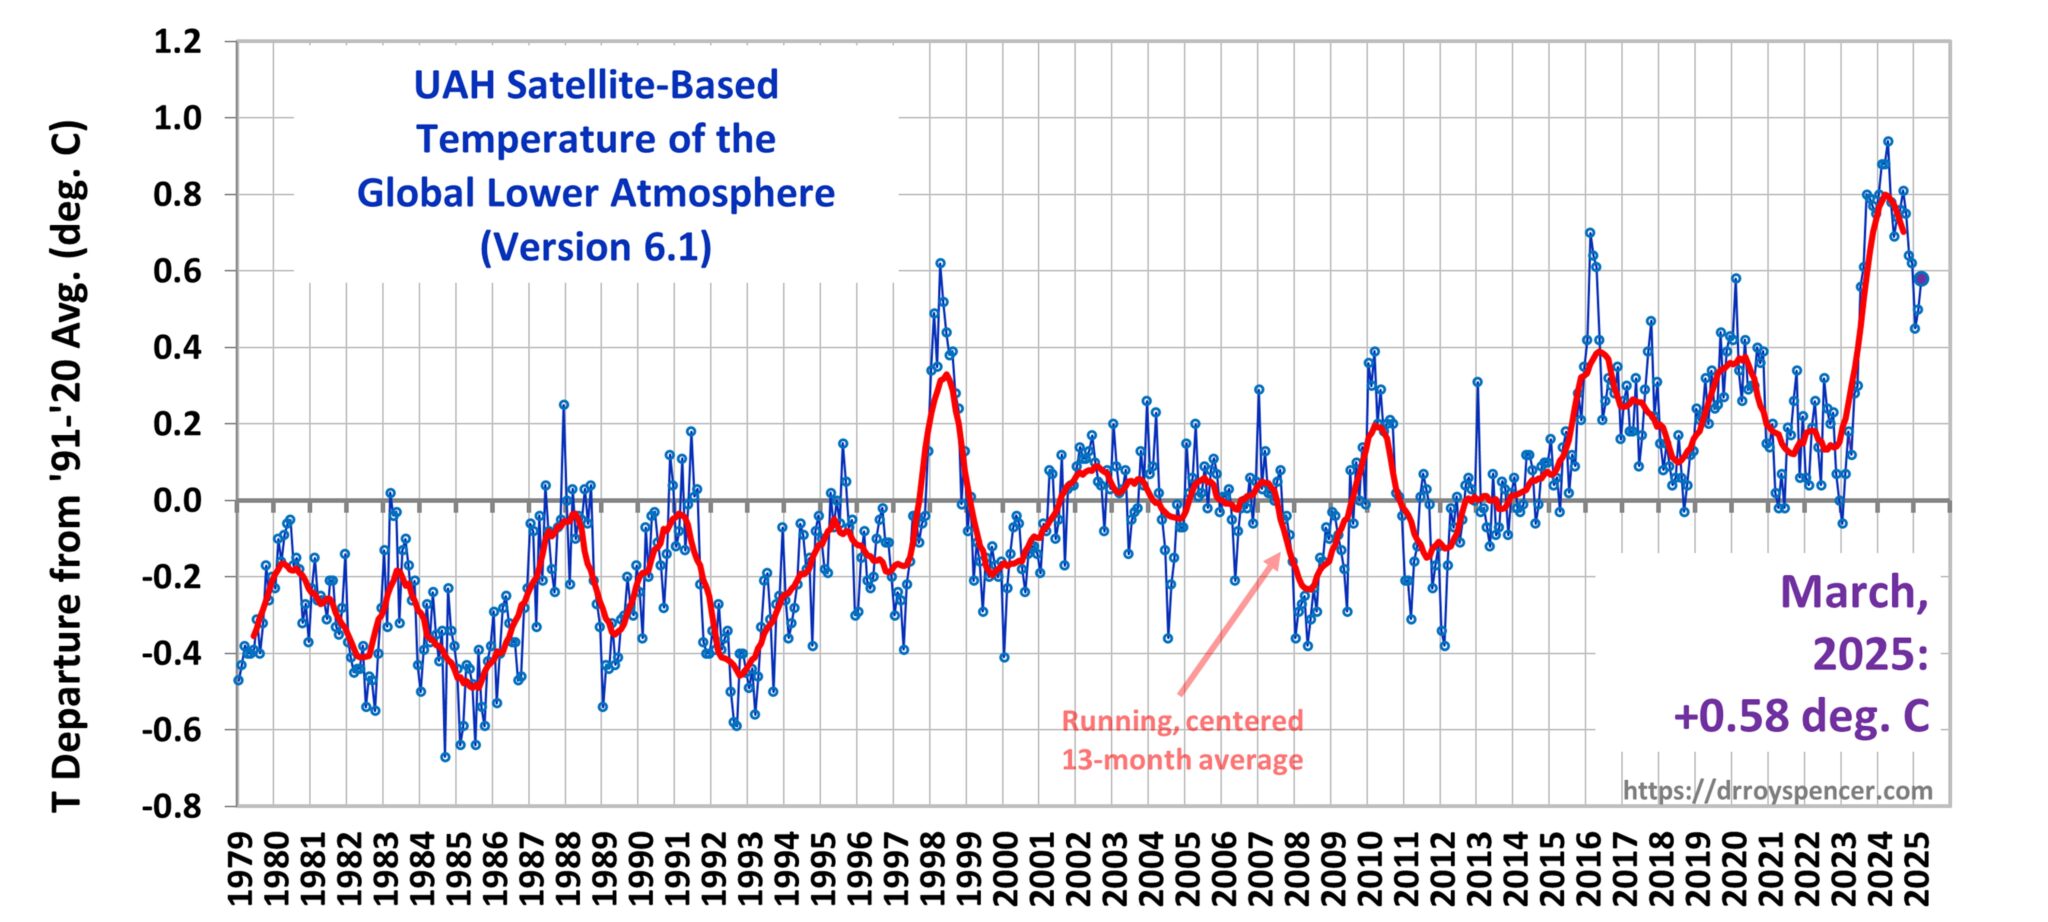
UAH v6.1 Global Temperature Update for March, 2025: +0.58 deg. C 

The Version 6.1 global average lower tropospheric temperature (LT) anomaly for March, 2025 was +0.58 deg. C departure from the 1991-2020 mean, up from the February, 2025 anomaly of +0.50 deg. C.

https://www.drroyspencer.com/wp-content/uploads/UAH_LT_1979_thru_March_2025_v6.1_20x9-2048x922.jpg

The Version 6.1 global area-averaged linear temperature trend (January 1979 through March 2025) remains at +0.15 deg/ C/decade (+0.22 C/decade over land, +0.13 C/decade over oceans).

The following table lists various regional Version 6.1 LT departures from the 30-year (1991-2020) average for the last 15 months (record highs are in red)....

....MUCH MORE

March 4, 2025 - Satellite-Inferred Global Temperature Anomaly Reversed Downtrend in February

Last month's temperature was within 1/100 of a degree C of our prop bet target and an unfamiliar flash of brilliance, easily suppressed, came to mind:

0.01°C away from the target.

If I was smart I'd just declare victory today, a full 15 months ahead of schedule and let the bet melt into the noise of the internet but as they say at the better science schools: Homie don't roll that way.

And now the decline has turned higher....

*See "Adaptive behaviour and learning in slime moulds: the role of oscillations"

Tuesday, March 4, 2025

Satellite-Inferred Global Temperature Anomaly Reversed Downtrend in February

Last month's temperature was within 1/100 of a degree C of our prop bet target and an unfamiliar flash of brilliance, easily suppressed, came to mind:

0.01°C away from the target.

If I was smart I'd just declare victory today, a full 15 months ahead of schedule and let the bet melt into the noise of the internet but as they say at the better science schools: Homie don't roll that way.

And now the decline has turned higher.

From Dr. Roy Spencer at the University of Alabama-Huntsville (along with Santa Clara CA's Remote Sensing Systems, one of the two keepers of the satellite record), March 3:

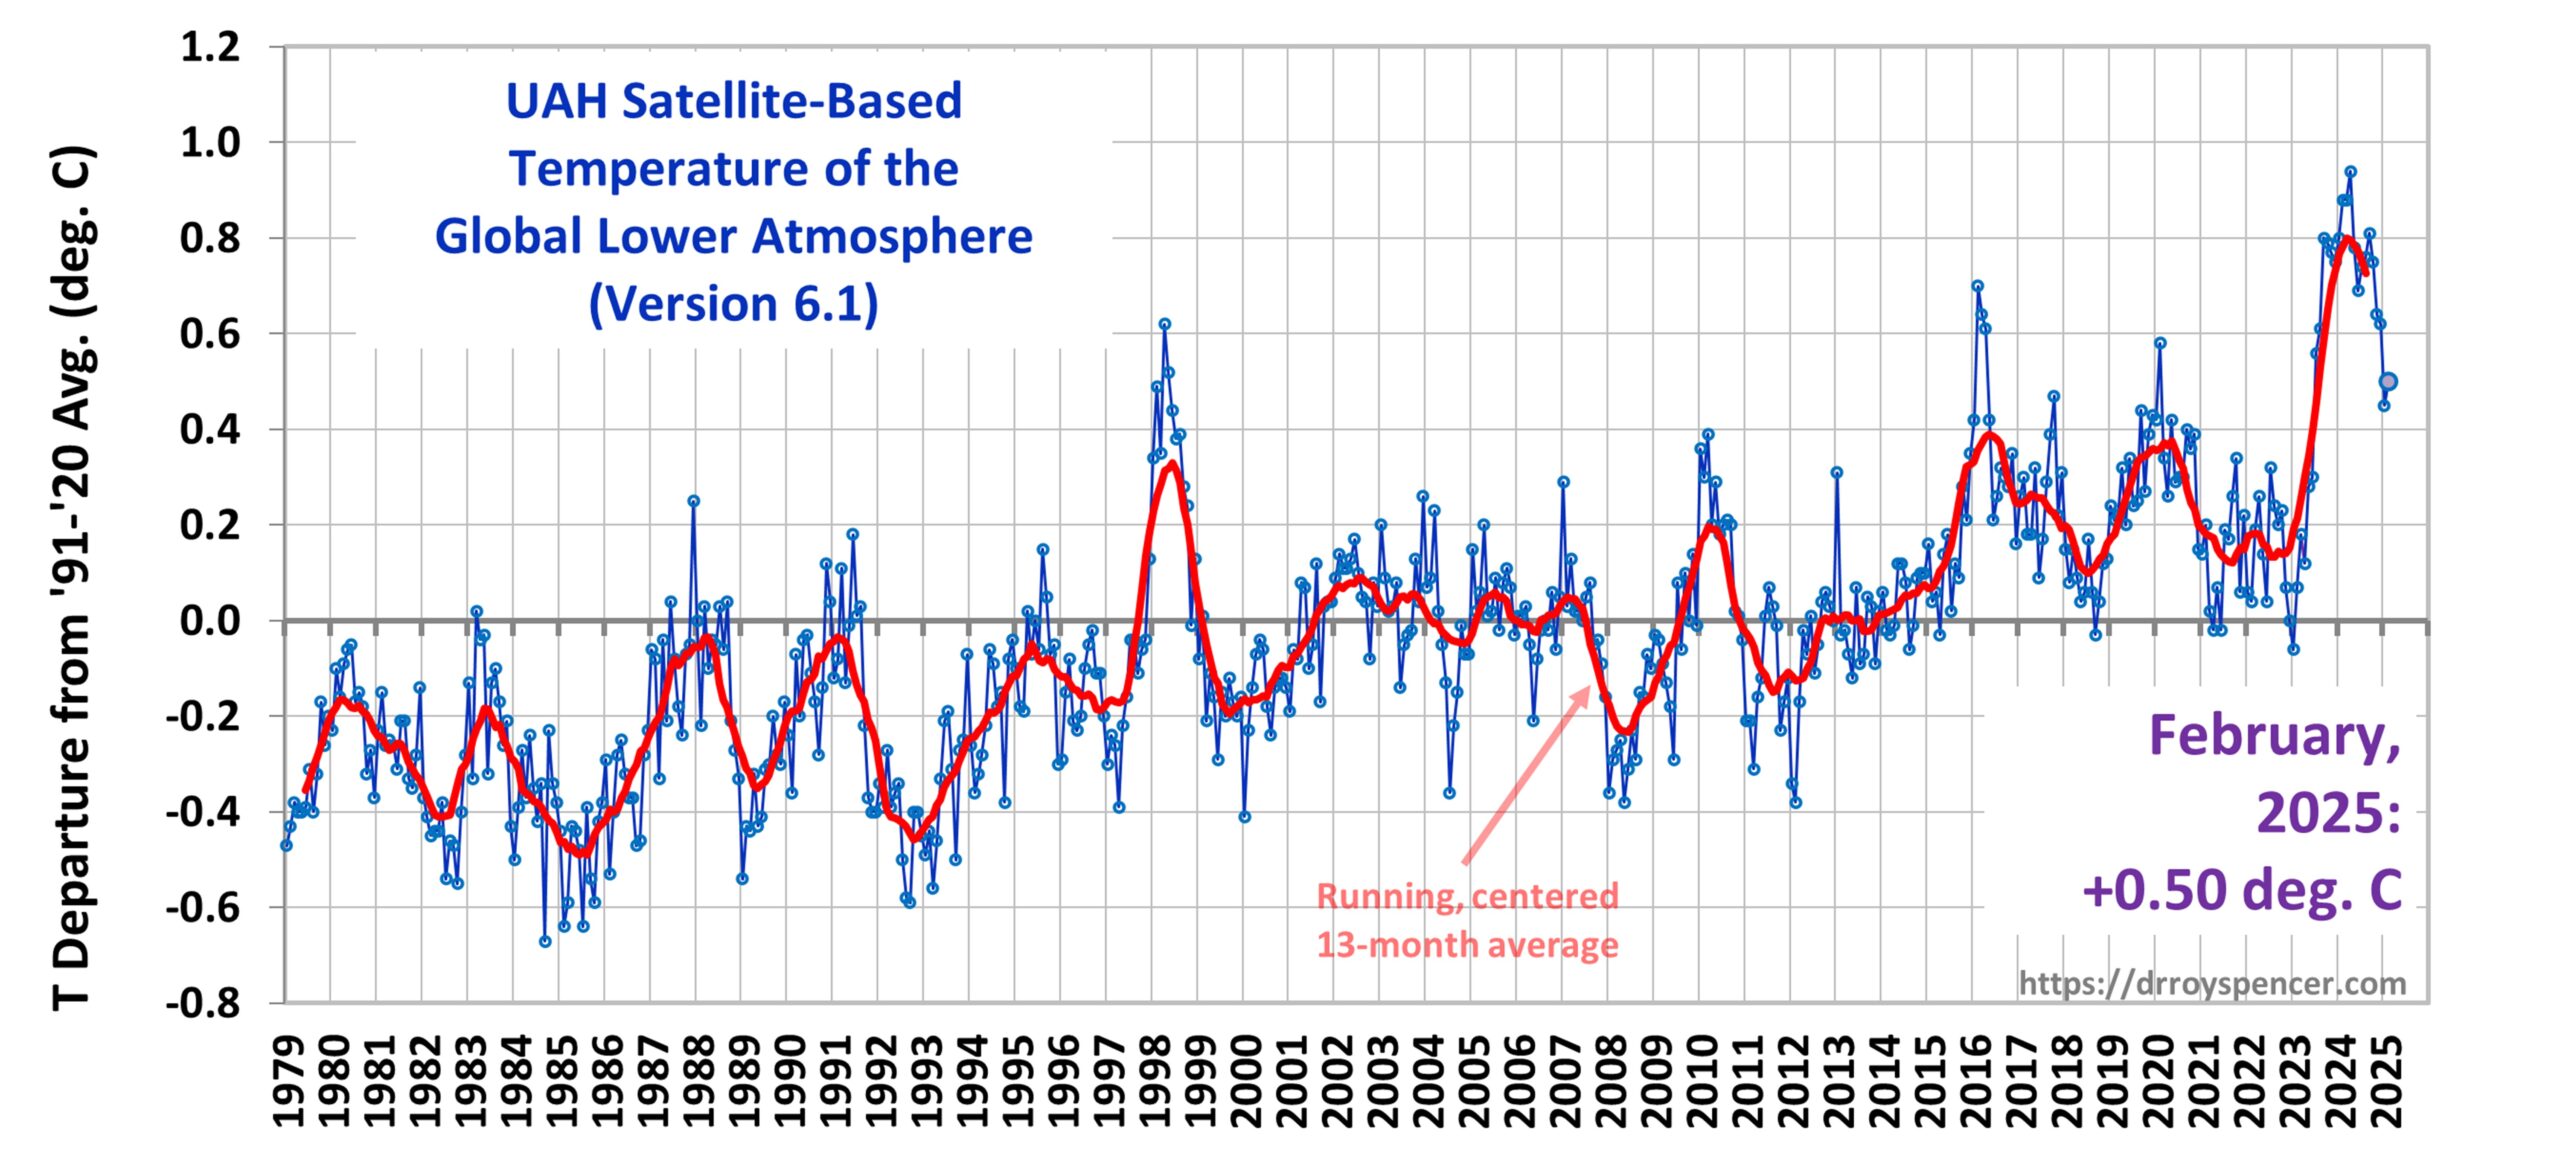
UAH v6.1 Global Temperature Update for February, 2025: +0.50 deg. C

The Version 6.1 global average lower tropospheric temperature (LT) anomaly for February, 2025 was +0.50 deg. C departure from the 1991-2020 mean, up a little from the January, 2025 anomaly of +0.45 deg. C.


The Version 6.1 global area-averaged linear temperature trend (January 1979 through February 2025) remains at +0.15 deg/ C/decade (+0.22 C/decade over land, +0.13 C/decade over oceans)....

....MUCH MORE

Our proposition bet has the UAH figure falling from +0.95°C the day we announced the bet, May 2, 2024 (three days later the April figure was announced, +1.05°C, not very good timing on the part of yours truly) to +0.45°C by the termination date:

Here's a prop bet for you. By May 15, 2026 we will see the satellite-measured -inferred global lower atmospheric temperature anomaly decline by at least 1/2 degree C.

The two keepers of the satellite record are Remote Sensing Systems in Santa Rosa CA and the University of Alabama-Huntsville.

Here's the temperature graph from UAH:....

If interested here is the series of monthly posts tracking the bet.

Tuesday, February 4, 2025

Satellite Global Average Lower Tropospheric Temperature Anomaly Down Dramatically In January (and an update on the prop bet)

Diarrhea outbreaks averted (for now)

From Dr. Roy Spencer at the University of Alabama - Huntsville, February 4: 

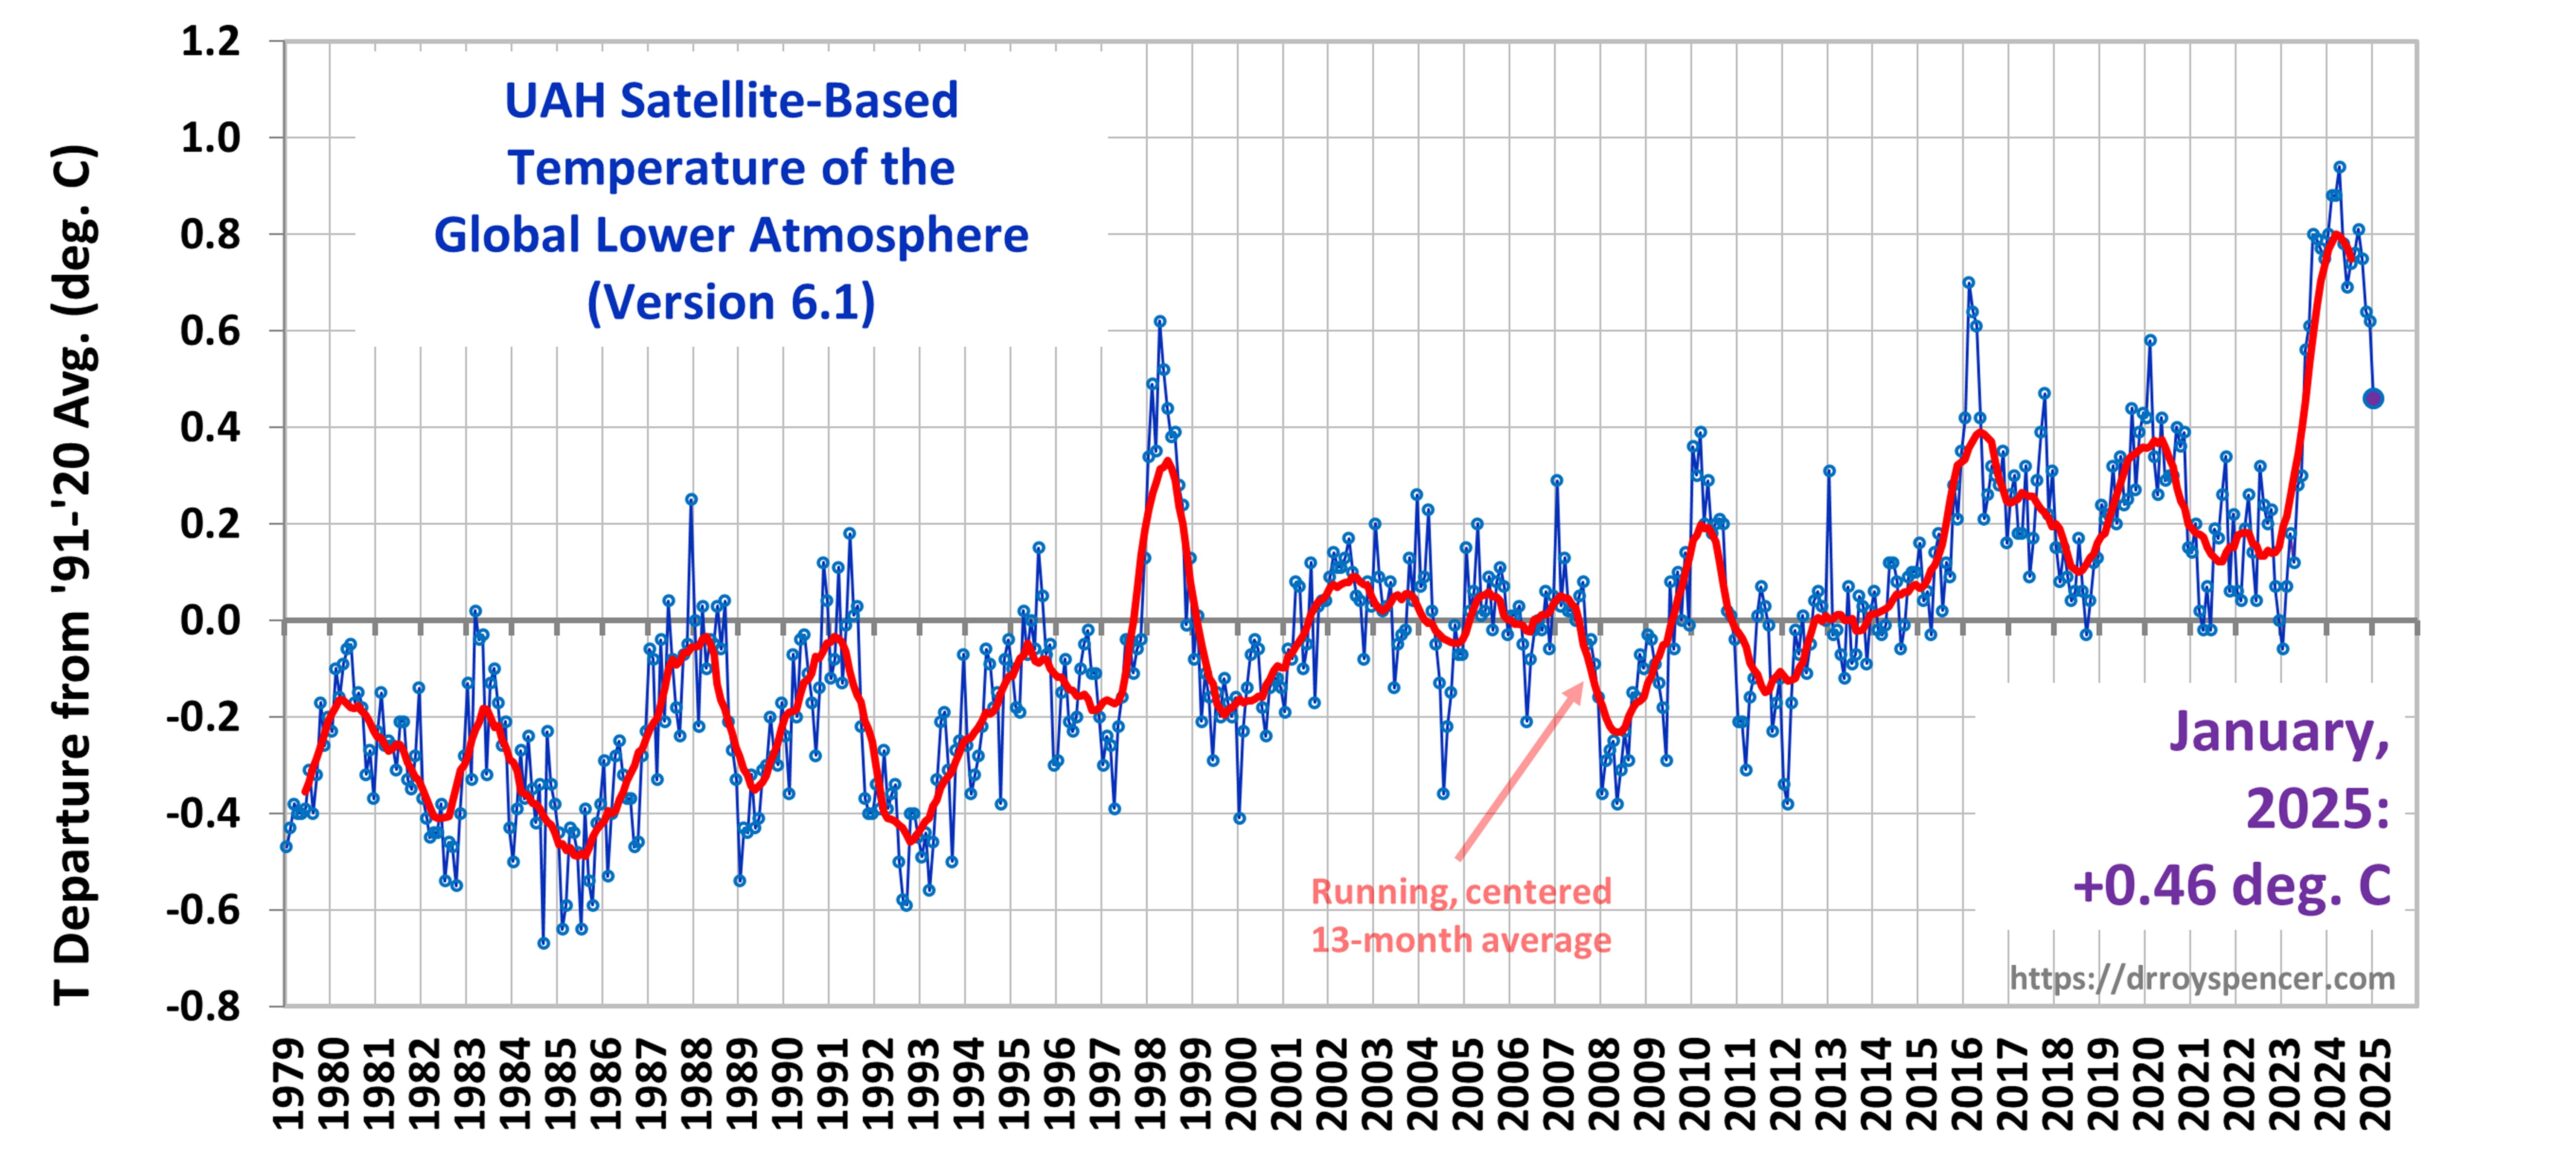
UAH v6.1 Global Temperature Update for January, 2025: +0.46 deg. C

The Version 6.1 global average lower tropospheric temperature (LT) anomaly for January, 2025 was +0.46 deg. C departure from the 1991-2020 mean, down substantially from the December, 2024 anomaly of +0.62 deg. Most of this cooling was over the global oceans.

https://www.drroyspencer.com/wp-content/uploads/UAH_LT_1979_thru_January_2025_v6.1_20x9-scaled.jpg

The Version 6.1 global area-averaged temperature trend (January 1979 through January 2025) remains at +0.15 deg/ C/decade (+0.22 C/decade over land, +0.13 C/decade over oceans)....

....MUCH MORE

This follows the record-high anomalies recorded in 2024 but is consistent with our prop. bet from May 2024.  

From the January 3 update:

Our proposition bet has the UAH figure falling from +0.95°C the day we announced the bet, May 2, 2024 (three days later the April figure was announced, +1.05°C, not very good timing on the part of yours truly) to +0.45°C by the termination date:

Here's a prop bet for you. By May 15, 2026 we will see the satellite-measured -inferred global lower atmospheric temperature anomaly decline by at least 1/2 degree C.

The two keepers of the satellite record are Remote Sensing Systems in Santa Rosa CA and the University of Alabama-Huntsville.

Here's the temperature graph from UAH:....

If interested here is the series of monthly posts tracking the bet. 

0.01°C away from the target.

If I was smart I'd just declare victory today, a full 15 months ahead of schedule and let the bet melt into the noise of the internet but as they say at the better science schools: Homie don't roll that way.

Friday, January 3, 2025

UAH Satellite-Inferred Global Temperature Anomaly: Down Slightly For December After Record High During 2024

Our proposition bet has the UAH figure falling from +0.95°C the day we announced the bet, May 2, 2024 (three days later the April figure was announced, +1.05°C, not very good timing on the part of yours truly) to +0.45°C by the termination date:

Here's a prop bet for you. By May 15, 2026 we will see the satellite-measured -inferred global lower atmospheric temperature anomaly decline by at least 1/2 degree C.

The two keepers of the satellite record are Remote Sensing Systems in Santa Rosa CA and the University of Alabama-Huntsville.

Here's the temperature graph from UAH:....

And from Dr. Roy Spencer at the University of Alabama-Huntsville, January 3, 2025:

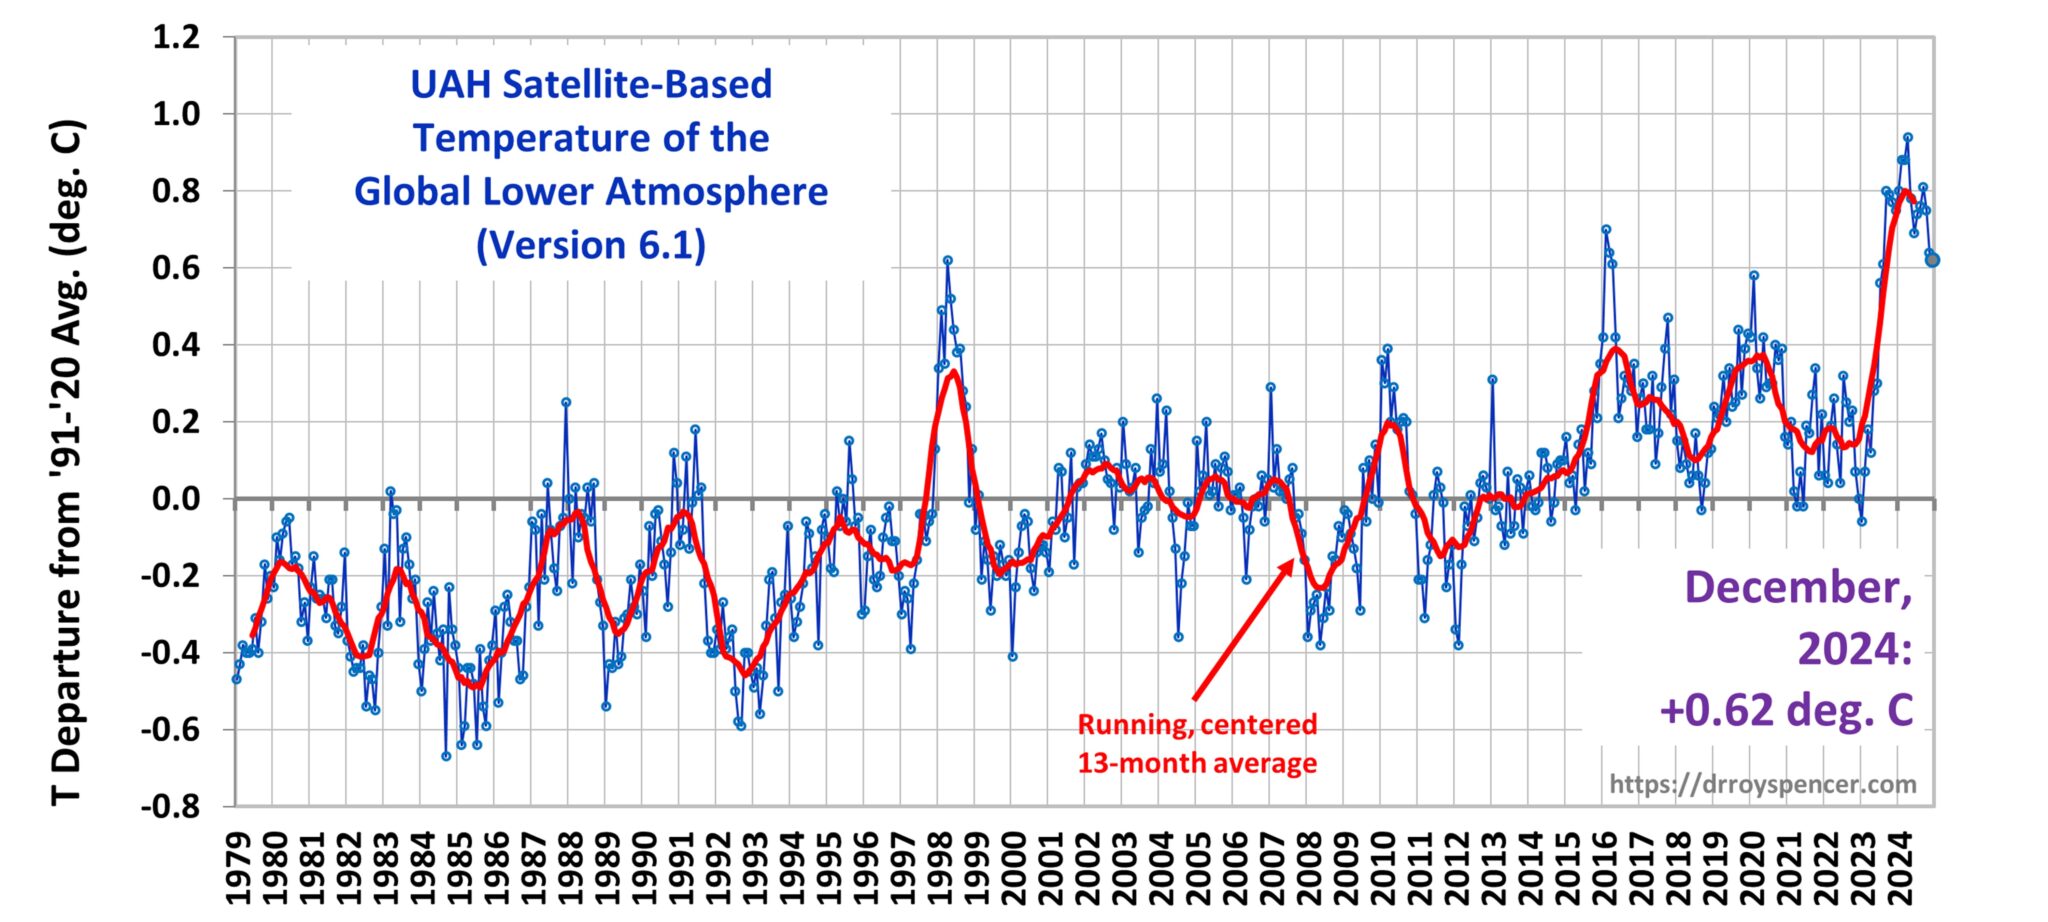
UAH v6.1 Global Temperature Update for December, 2024: +0.62 deg. C

2024 Sets New Record for Warmest Year In Satellite Era (Since 1979)

The Version 6.1 global average lower tropospheric temperature (LT) anomaly for December, 2024 was +0.62 deg. C departure from the 1991-2020 mean, down slightly from the November, 2024 anomaly of +0.64 deg.

https://www.drroyspencer.com/wp-content/uploads/UAH_LT_1979_thru_December_2024_v6.1_20x9-2048x922.jpg

The Version 6.1 global area-averaged temperature trend (January 1979 through December 2024) remains at +0.15 deg/ C/decade (+0.22 C/decade over land, +0.13 C/decade over oceans).

As seen in the following ranking of the years from warmest to coolest, 2024 was by far the warmest in the 46-year satellite record averaging 0.77 deg. C above the 30-year mean, while the 2nd warmest year (2023) was +0.43 deg. C above the 30-year mean. [Note: These yearly average anomalies weight the individual monthly anomalies by the number of days in each month.]....

....MUCH MORE

Tuesday, December 3, 2024

Satellite-Inferred Global Temperature Continued Downtrend in November

Following on last month's "Satellite-Inferred Global Temperature Down In October—With A Caveat" where the drift of NASA's satellites forced a truncation of the dataset.

From Dr. Roy Spencer at the University of Alabama-Huntsville, (UAH) December 3:

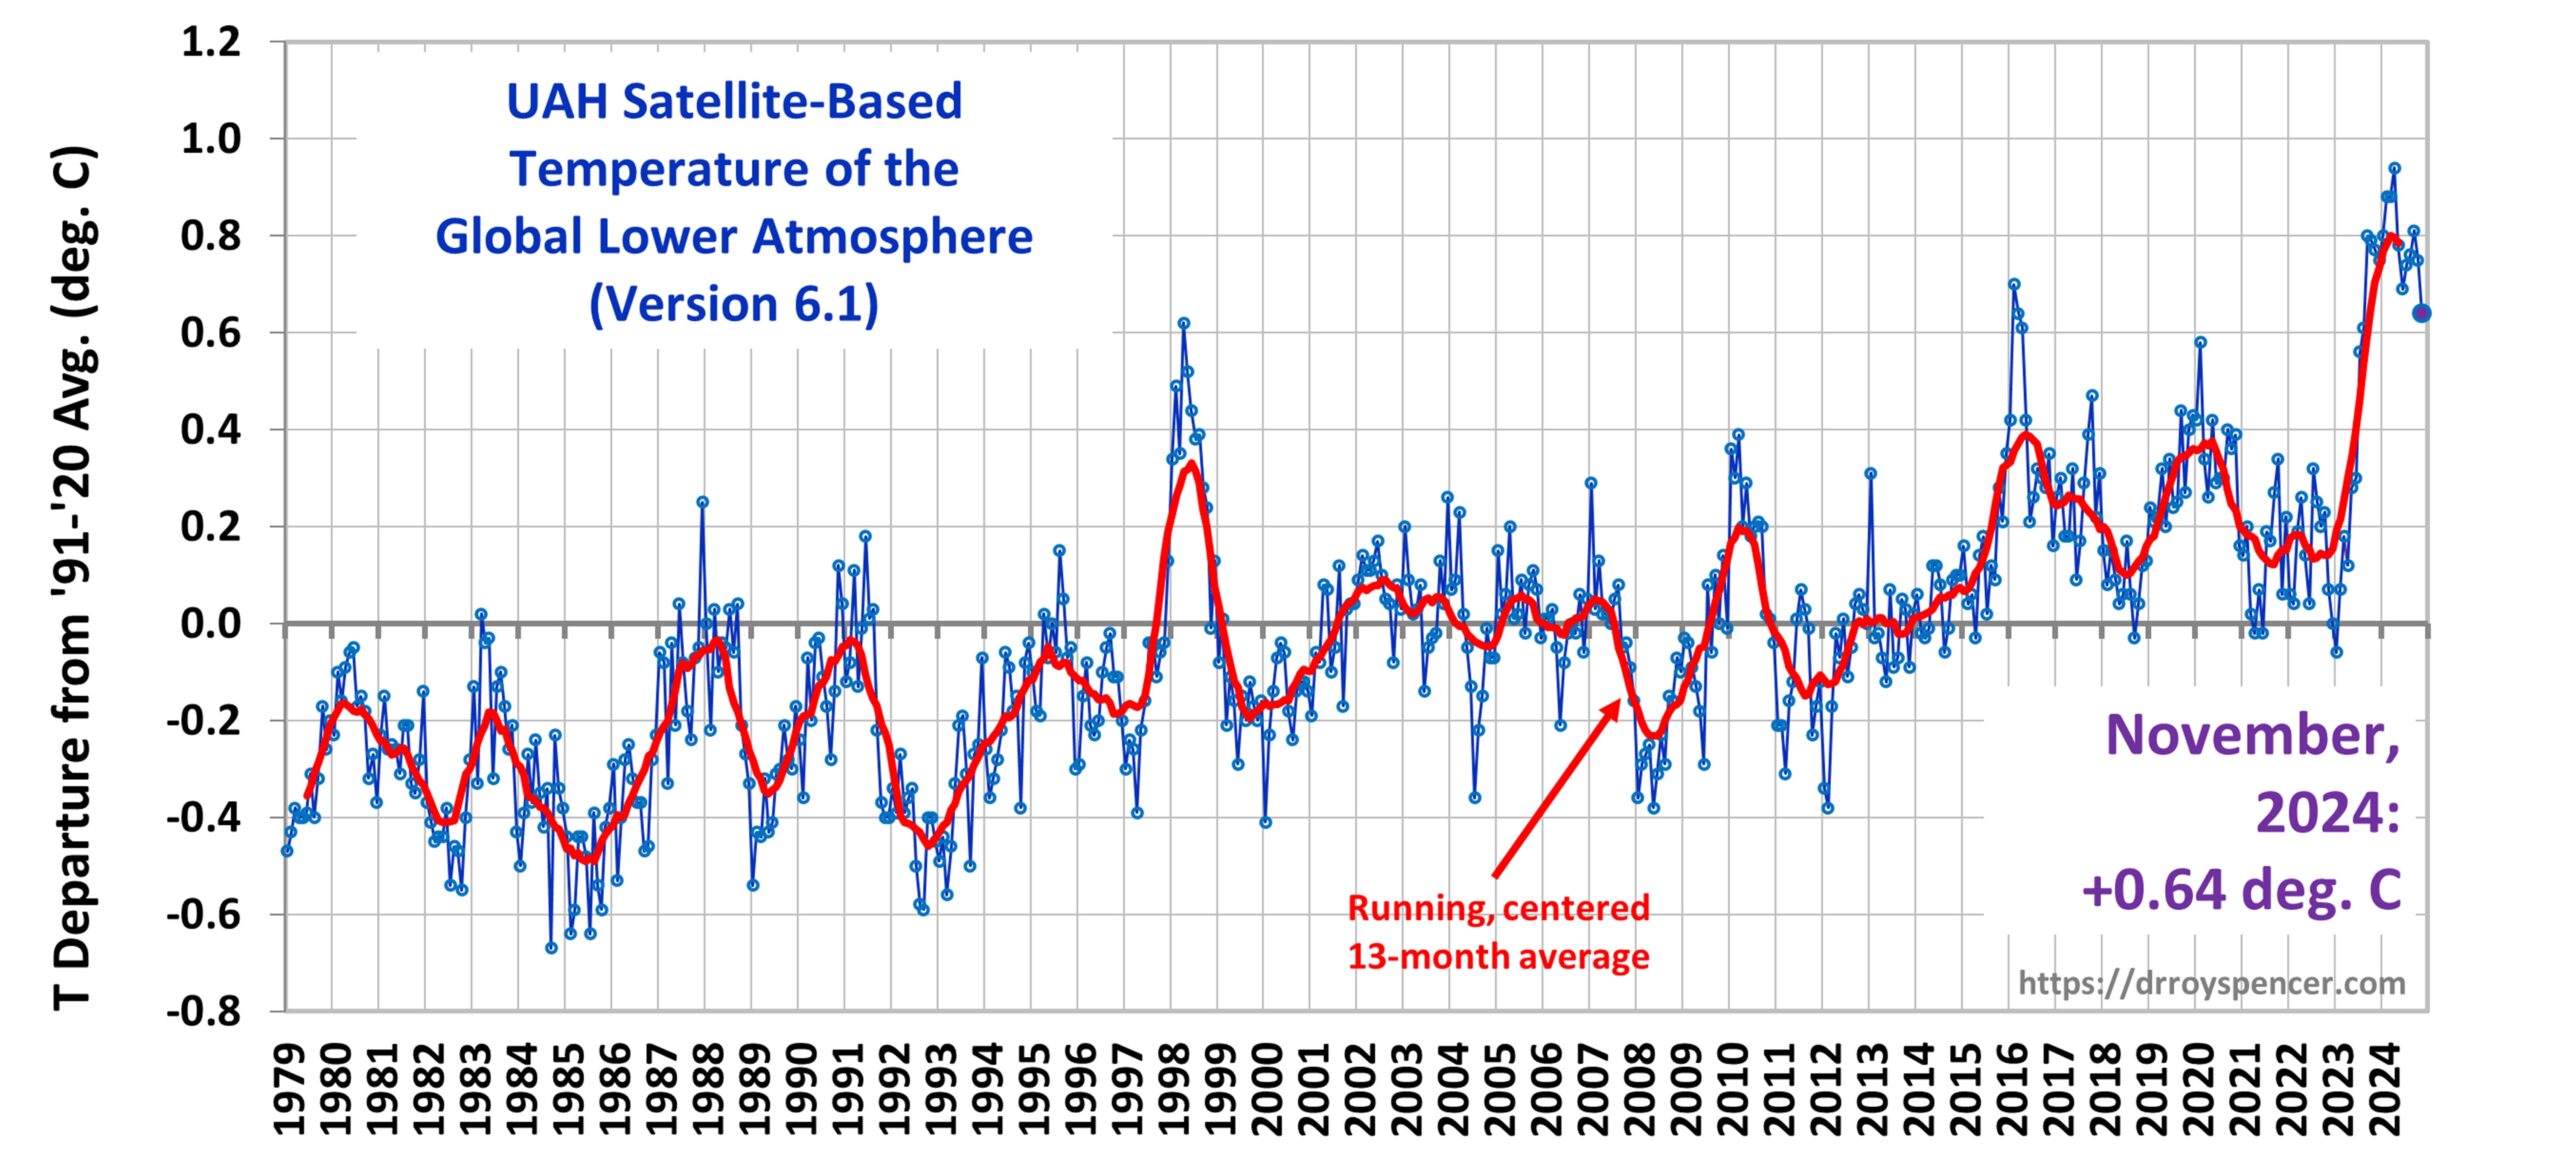
UAH v6.1 Global Temperature Update for November, 2024: +0.64 deg. C

Metop-C Satellite Added to Our Processing

With this update, we have added Metop-C to our processing, so along with Metop-B we are back to having two satellites in the processing stream. The Metop-C data record begins in July of 2019. Like Metop-B, Metop-C was designed to use fuel to maintain its orbital altitude and inclination, so (until fuel reserves are depleted) there is no diurnal drift adjustment needed. Metop-B is beginning to show some drift in the last year or so, but it’s too little at this point to worry about any diurnal drift correction.

The Version 6.1 global average lower tropospheric temperature (LT) anomaly for November, 2024 was +0.64 deg. C departure from the 1991-2020 mean, down from the October, 2024 anomaly of +0.75 deg. C.


The Version 6.1 global area-averaged temperature trend (January 1979 through November 2024) remains at +0.15 deg/ C/decade (+0.21 C/decade over land, +0.13 C/decade over oceans).

The following table lists various regional Version 6.1 LT departures from the 30-year (1991-2020) average for the last 23 months (record highs are in red). Note the tropics have cooled by 0.72 deg. C in the last 8 months, consistent with the onset of La Nina conditions....

....MUCH MORE

We will have to factor-in the dataset discontinuity when we do the final tally on our prop bet.

If interested see the bet saga:

From May 5's "UAH Global Temperature Update: April Sees New High Temperature Anomaly For The Satellite Era":

Great, just effin' great. I had to go shooting my mouth off with a prop bet on May 2, couldn't wait for the new number to be released, no sirree, had to be posted when the memory to post it was triggered:

Here's a prop bet for you. By May 15, 2026 we will see the satellite-measured -inferred global lower atmospheric temperature anomaly decline by at least 1/2 degree C.

The two keepers of the satellite record are Remote Sensing Systems in Santa Rosa CA and the University of Alabama-Huntsville.

Here's the temperature graph from UAH:....

****


and repeated: "Again the baseline for the prop bet: the above 'Latest Global Temp. Anomaly (March '24: +0.95°C)'" 

Well here's Roy Spencer, PhD from the University of Alabama-Huntsville at his personal site, later on that same day that shall live in infamy, May 2, 2024:

UAH Global Temperature Update for April, 2024: +1.05 deg. C....

June 5
UAH Global Temperature Update: May Sees Temperature Anomaly Come Down A Bit
The University of Alabama-Huntsville is one of the two keepers of the satellite temperature record (along with Remote Sensing Systems). Here's UAH's Dr. Roy Spencer with the update and our adventures in prop bets after the jump.
July 3
Latest Global Average Tropospheric Temperature Anomaly Comes Down A Little Bit More (plus the prop bet, month 3)

Tuesday, November 5, 2024

Satellite-Inferred Global Temperature Down In October—With A Caveat

From one of the two keepers of the satellite temperature record, the University of Alabama - Huntsville's Dr. Roy Spencer, November 2:

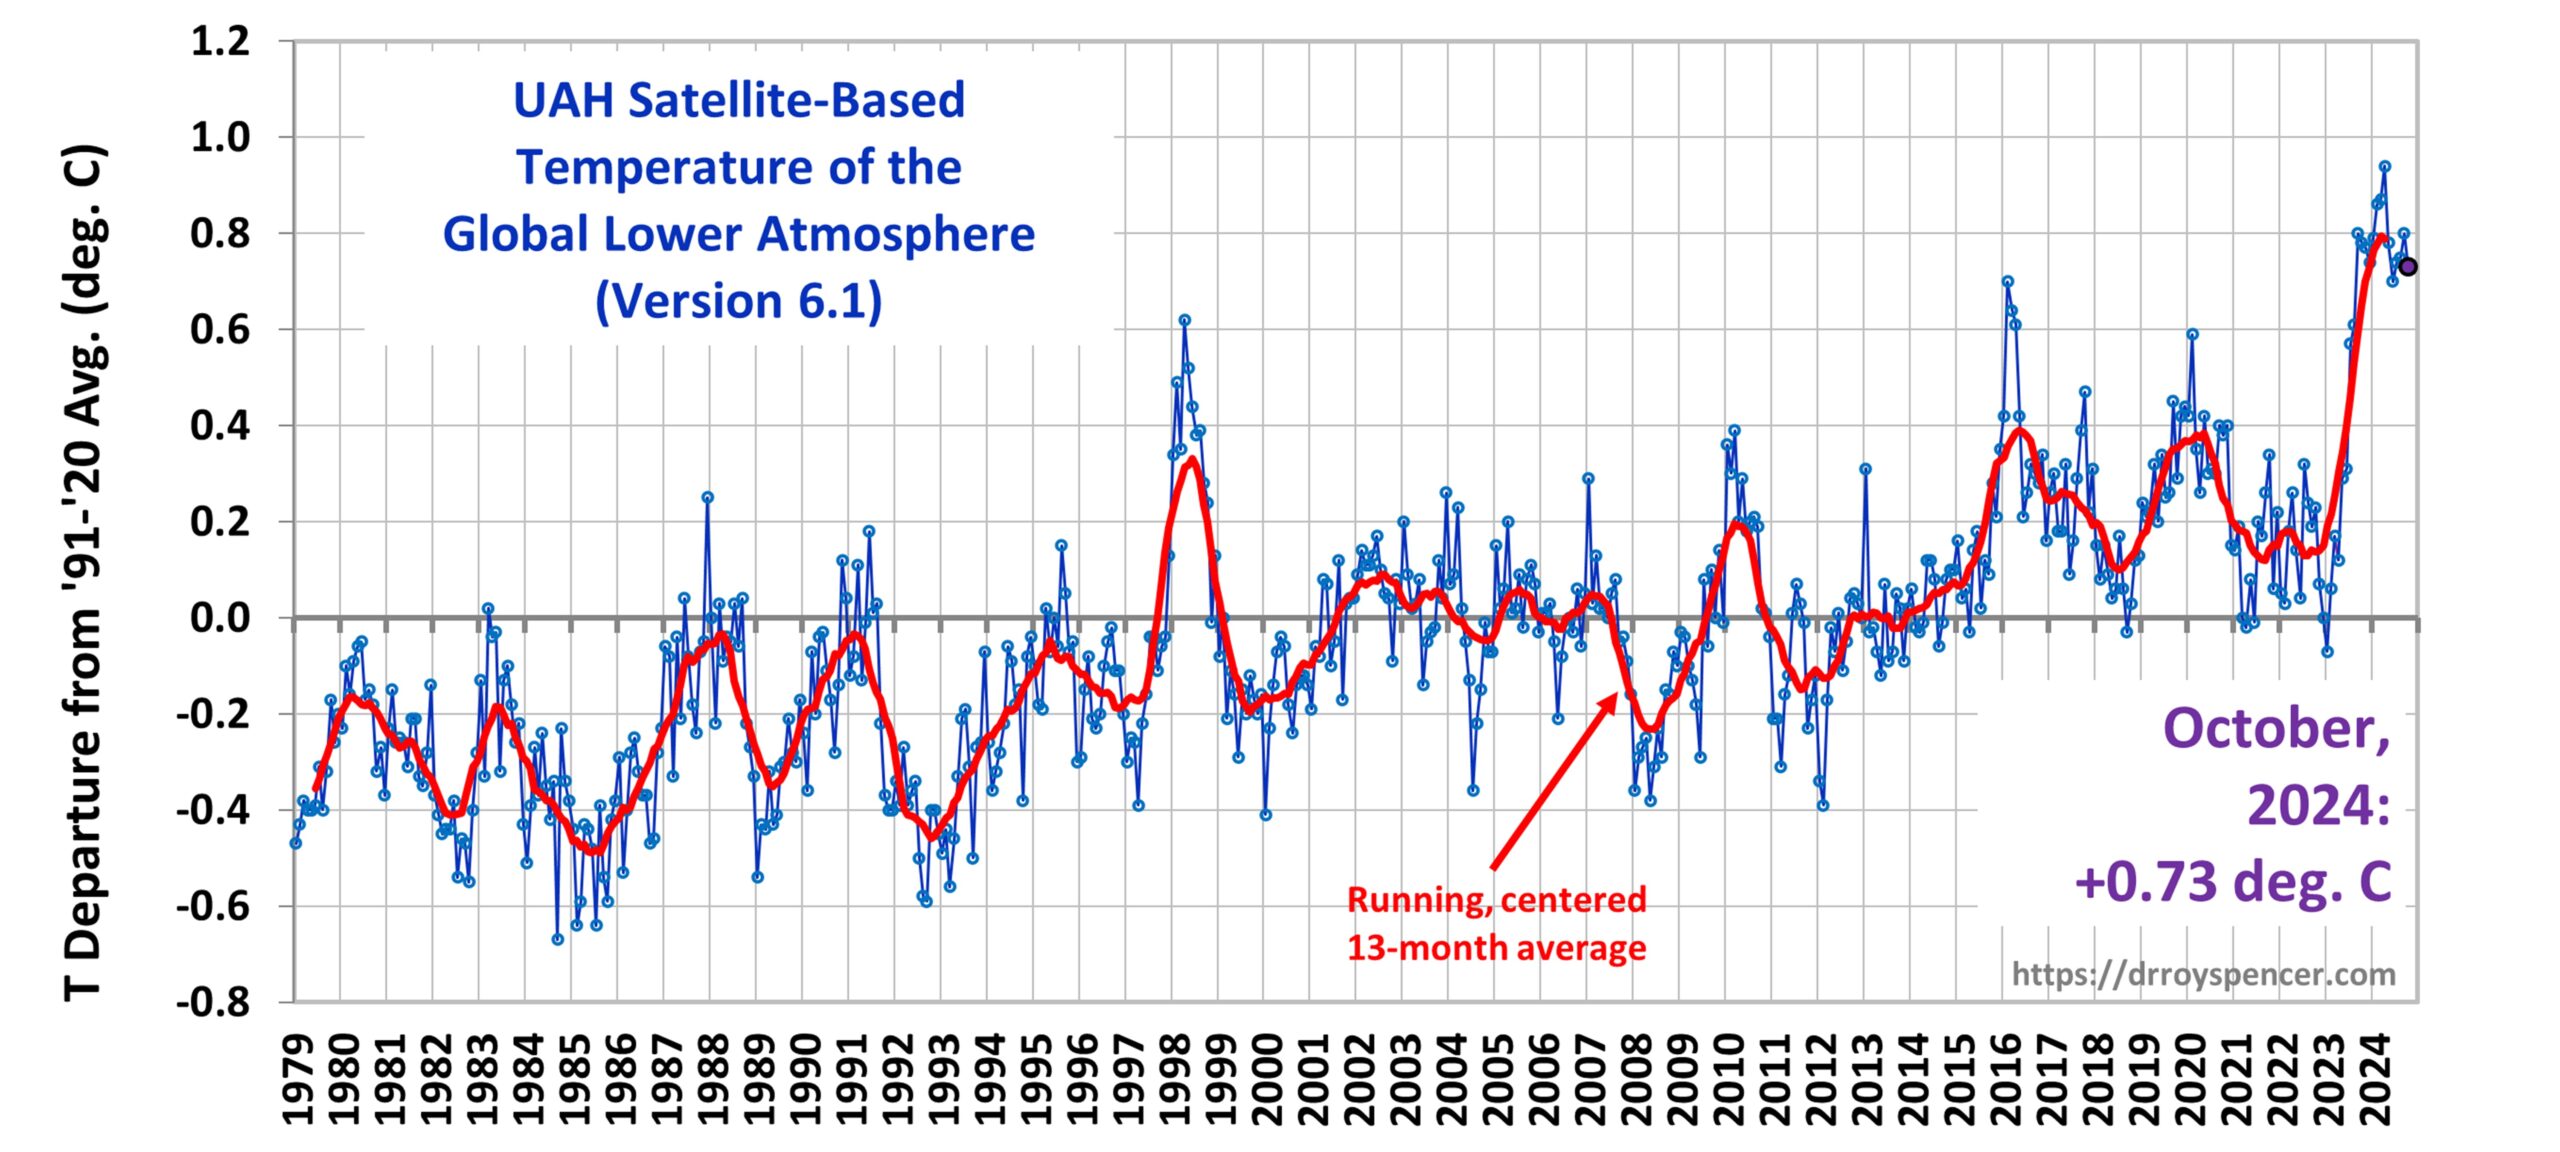
UAH v6.1 Global Temperature Update for October, 2024: +0.73 deg. C After Truncation of the NOAA-19 Satellite Record

The Version 6.1 global average lower tropospheric temperature (LT) anomaly for October, 2024 was +0.73 deg. C departure from the 1991-2020 mean, down from the September, 2024 anomaly of +0.80 deg. C.

https://www.drroyspencer.com/wp-content/uploads/UAH_LT_1979_thru_October_2024_v6.1_20x9-scaled.jpg

The new (Version 6.1) global area-averaged temperature trend (January 1979 through October 2024) is now +0.15 deg/ C/decade (+0.21 C/decade over land, +0.13 C/decade over oceans).

The previous (version 6.0) trends through September 2024 were +0.16 C/decade (global), +0.21 C/decade (land) and +0.14 C/decade (ocean).

The following provides background for the change leading to the new version (v6.1) of the UAH dataset.

NOTE: Snide comments which suggest someone has not read (and understood) that which follows will lead to comment privileges being revoked.

Key Points

  • The older NOAA-19 satellite has now drifted too far through the diurnal cycle for our drift correction methodology to provide useful adjustments. Therefore, we have decided to truncate the NOAA-19 data processing starting in 2021. This leaves Metop-B as the only satellite in the UAH dataset since that date. This truncation is consistent with those made to previous satellites after orbital drift began to impact temperature measurements.
  • This change reduces recent record global warmth only a little, bringing our calculated global temperatures more in line with the RSS and NOAA satellite datasets over the last 2-3 years.
  • Despite the reduction in recent temperatures, the 1979-2024 trend is reduced by only 0.01 deg/ C/decade, from +0.16 C/decade to +0.15 C per decade. Recent warmth during 2023-2024 remains record-setting for the satellite era, with each month since October 2023 setting a record for that calendar month.

Background

Monitoring of global atmospheric deep-layer temperatures with satellite microwave radiometers (systems originally designed for daily global weather monitoring) has always required corrections and adjustments to the calibrated data to enable long-term trend detection. The most important of these corrections/adjustments are:

  1. Satellite calibration biases, requiring intercalibration between successively launched satellites during overlaps in operational coverage. These adjustments are typically tenths of a degree C.
  2. Drift of the orbits from their nominal sun-synchronous observation times, requiring empirical corrections from comparison of a drifting satellite to a non-drifting satellite (the UAH method), or from climate models (the Remote Sensing Systems [RSS] method, which I believe the NOAA dataset also uses). These corrections can reach 1 deg. C or more for the lower tropospheric (LT) temperature product, especially over land and during the summer.
  3. Correction for instrument body temperature effects on the calibrated temperature (an issue with only the older MSU instruments, which produced spurious warming).
  4. Orbital altitude decay adjustment for the multi-view angle version of the lower tropospheric (LT) product (no longer needed for the UAH dataset as of V6.0, which uses multiple channels instead of multiple angles from a single channel.)

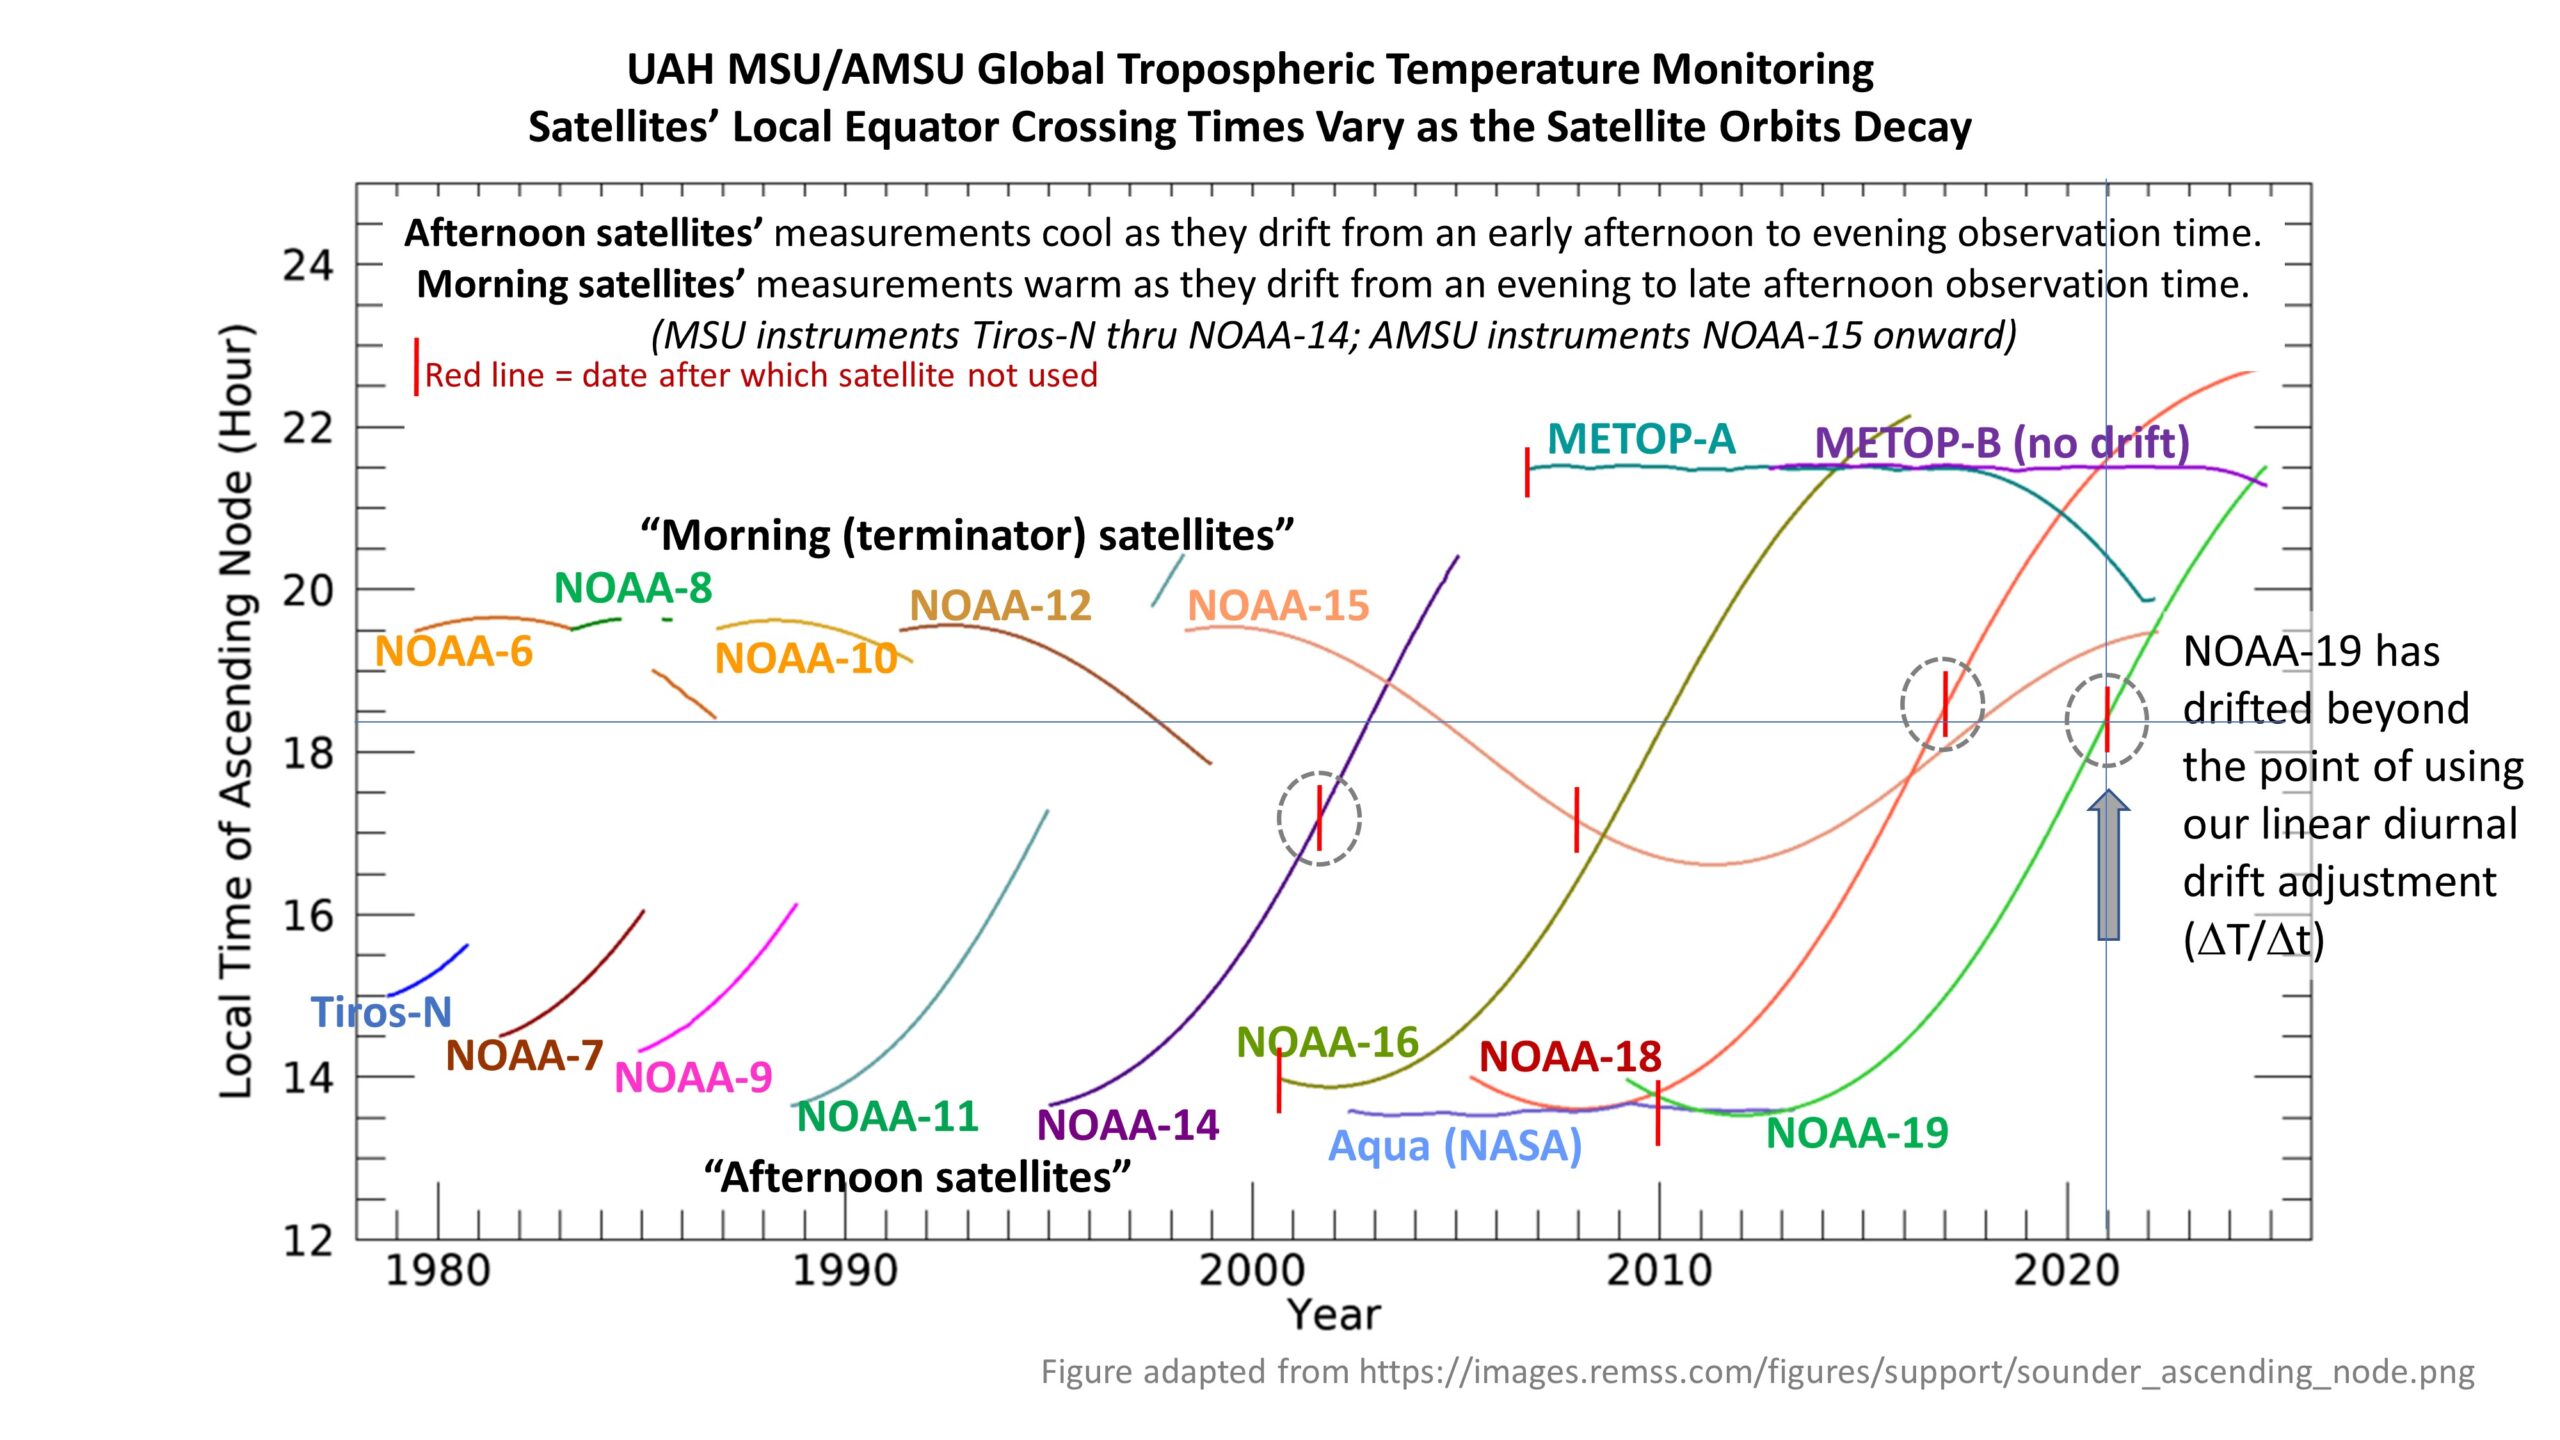
The second of these adjustments (diurnal drift) is the subject of the change made going from from UAH v6.0 to v6.1. The following chart shows the equator crossing times (local solar time) for the various satellites making up the satellite temperature record. The drift of the satellites (except the non-drifting Aqua and MetOp satellites, which have fuel onboard to allow orbit maintenance) produces cooling for the afternoon satellites’ LT measurements as the afternoon observation transitions from early afternoon to evening. Drift of the morning satellites makes their LT temperatures warm as their evening observations transition to the late afternoon....

....MUCH MORE

Monday, September 2, 2024

August 2024 Global Satellite Temperature Anomaly Up A Bit More (plus an update on the prop bet)

From Dr. Roy Spencer of the University of Alabama-Huntsville, September 2:

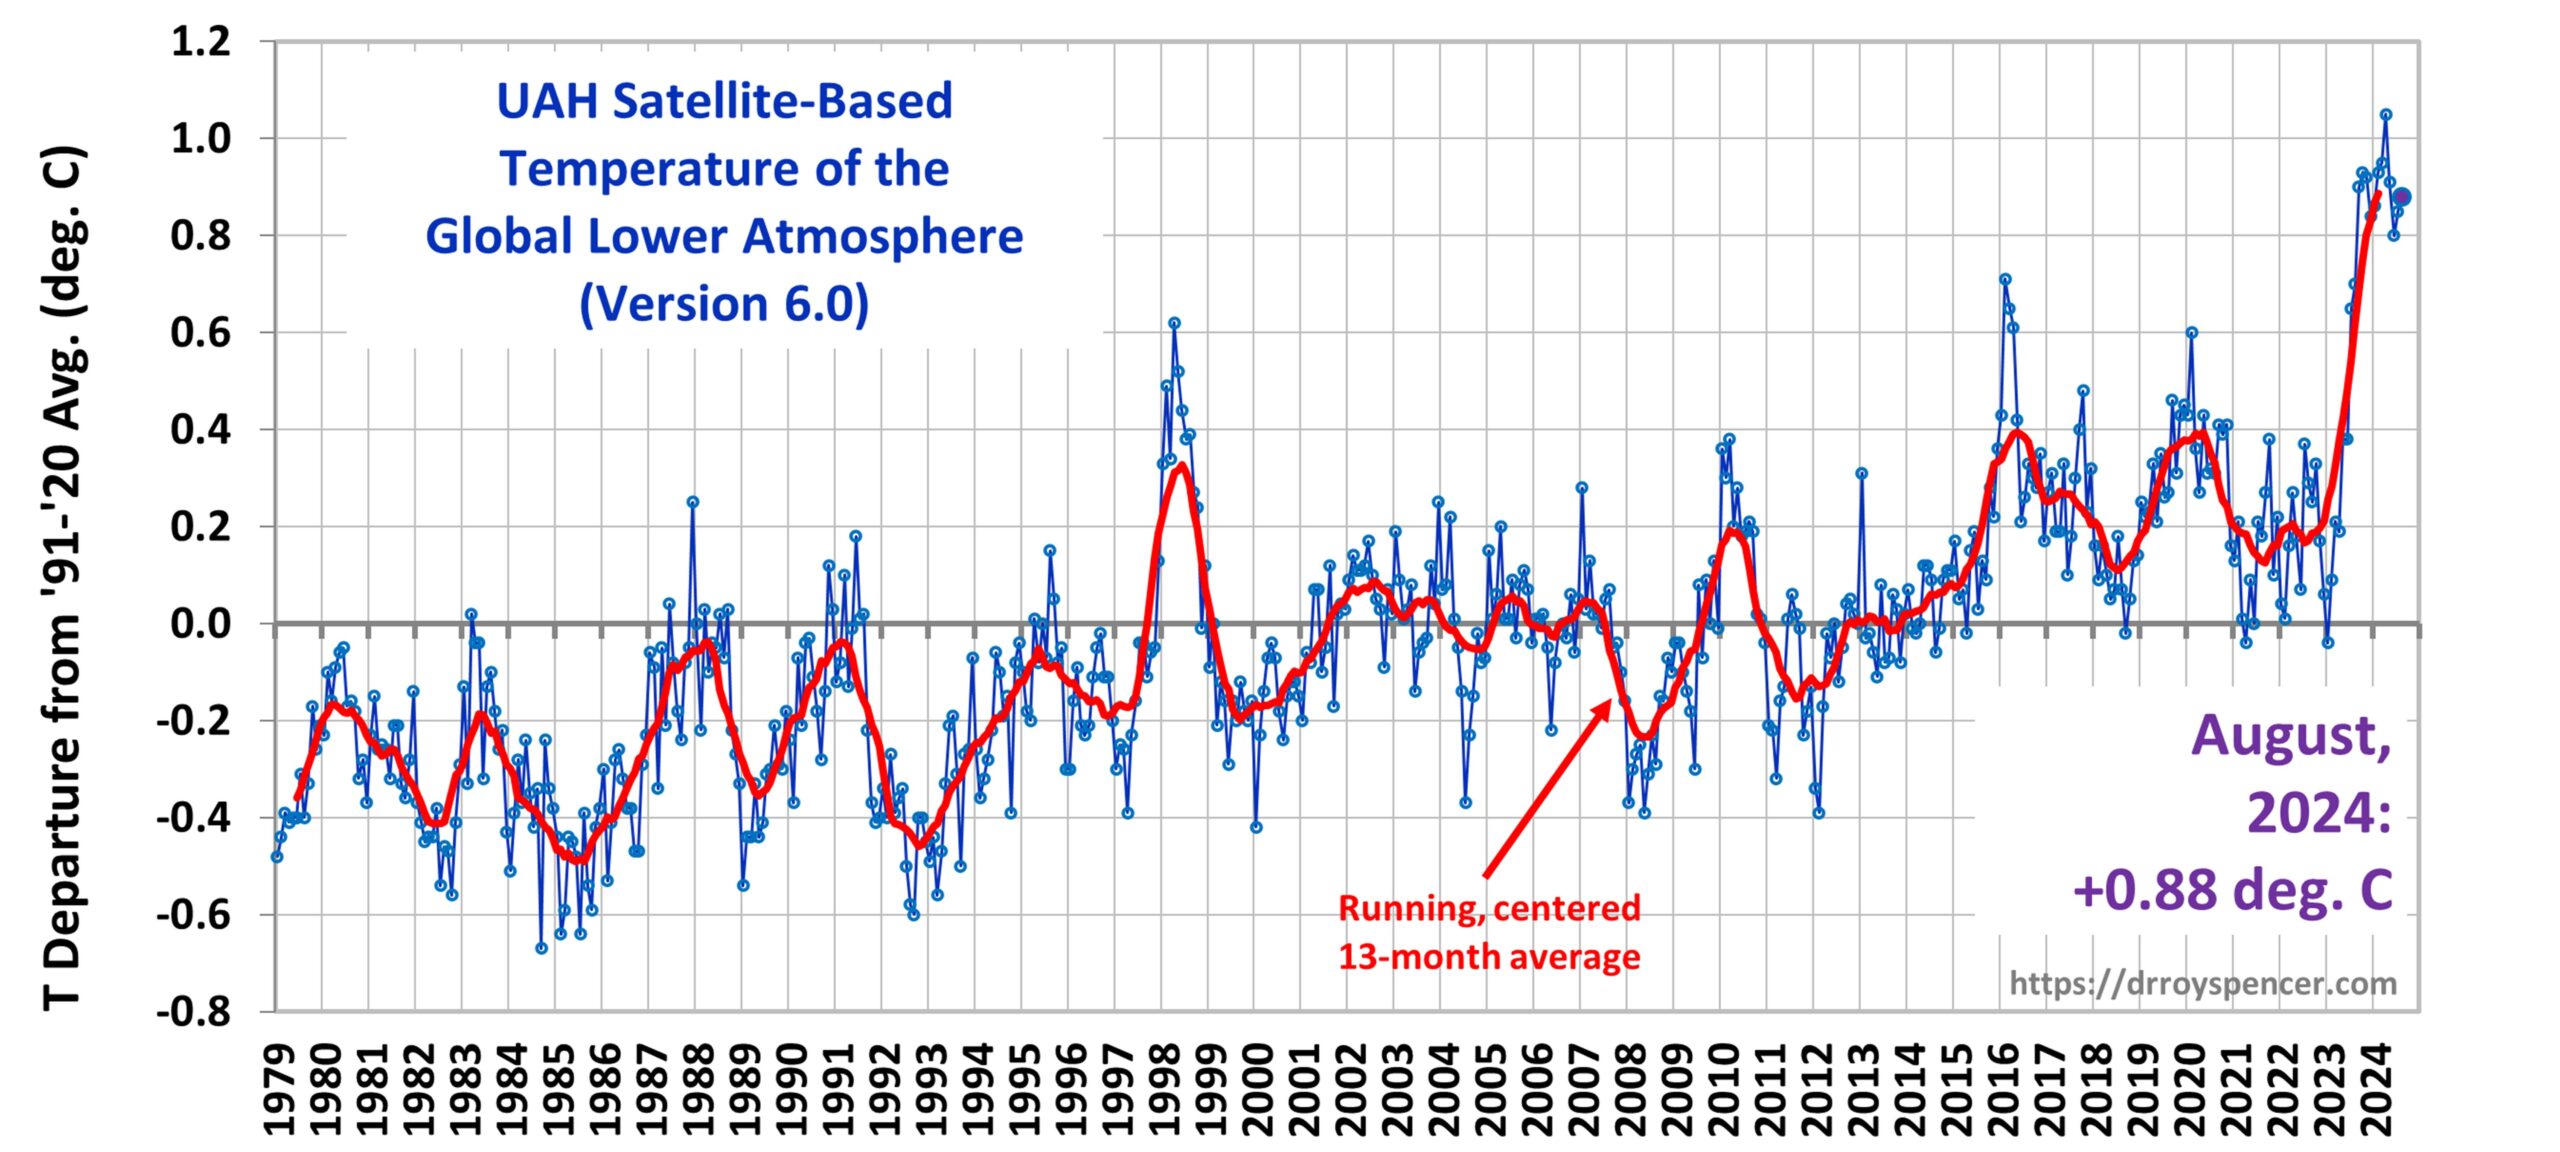
UAH Global Temperature Update for August, 2024: +0.88 deg. C

The Version 6 global average lower tropospheric temperature (LT) anomaly for August, 2024 was +0.88 deg. C departure from the 1991-2020 mean, up slightly from the July, 2024 anomaly of +0.85 deg. C.


Persistent global-averaged warmth was (unusually) contributed to this month by the Southern Hemisphere. Of the 27 regions we routinely monitor, 5 of them set record-warm (or near-record) high monthly temperature anomalies in August, all due to contributions from the Southern Hemisphere:

Global land: +1.35 deg. C

Southern Hemisphere land: +1.87 deg. C

Southern Hemisphere extratropical land: +2.23 deg. C

Antarctica: +3.31 deg. C (2nd place, previous record was +3.37 deg. C, Aug. 1996)

Australia: +1.80 deg. C.

The linear warming trend since January, 1979 now stands at +0.16 C/decade (+0.14 C/decade over the global-averaged oceans, and +0.21 C/decade over global-averaged land)....

....MUCH MORE

Previously:

May 2  Major eruption at Ruang volcano, ash to 19.2 km (63 000 feet) a.s.l., Indonesia

Here's a prop bet for you. By May 15, 2026 we will see the satellite-measured -inferred global lower atmospheric temperature anomaly decline by at least 1/2 degree C. [to +0.45 deg. C]

The two keepers of the satellite record are Remote Sensing Systems in Santa Rosa CA and the University of Alabama-Huntsville.... 
May 5 UAH Global Temperature Update: April Sees New High Temperature Anomaly For The Satellite Era

Great, just effin' great. I had to go shooting my mouth off with a prop bet on May 2, couldn't wait for the new number to be released, no sirree, had to be posted when the memory to post it was triggered...

June 5 UAH Global Temperature Update: May Sees Temperature Anomaly Come Down A Bit

July 3 Latest Global Average Tropospheric Temperature Anomaly Comes Down A Little Bit More (plus the prop bet, month 3) 

August 6 July 2024 Global Satellite Temperature Anomaly Up A Bit (plus an update on the prop bet)

Tuesday, August 6, 2024

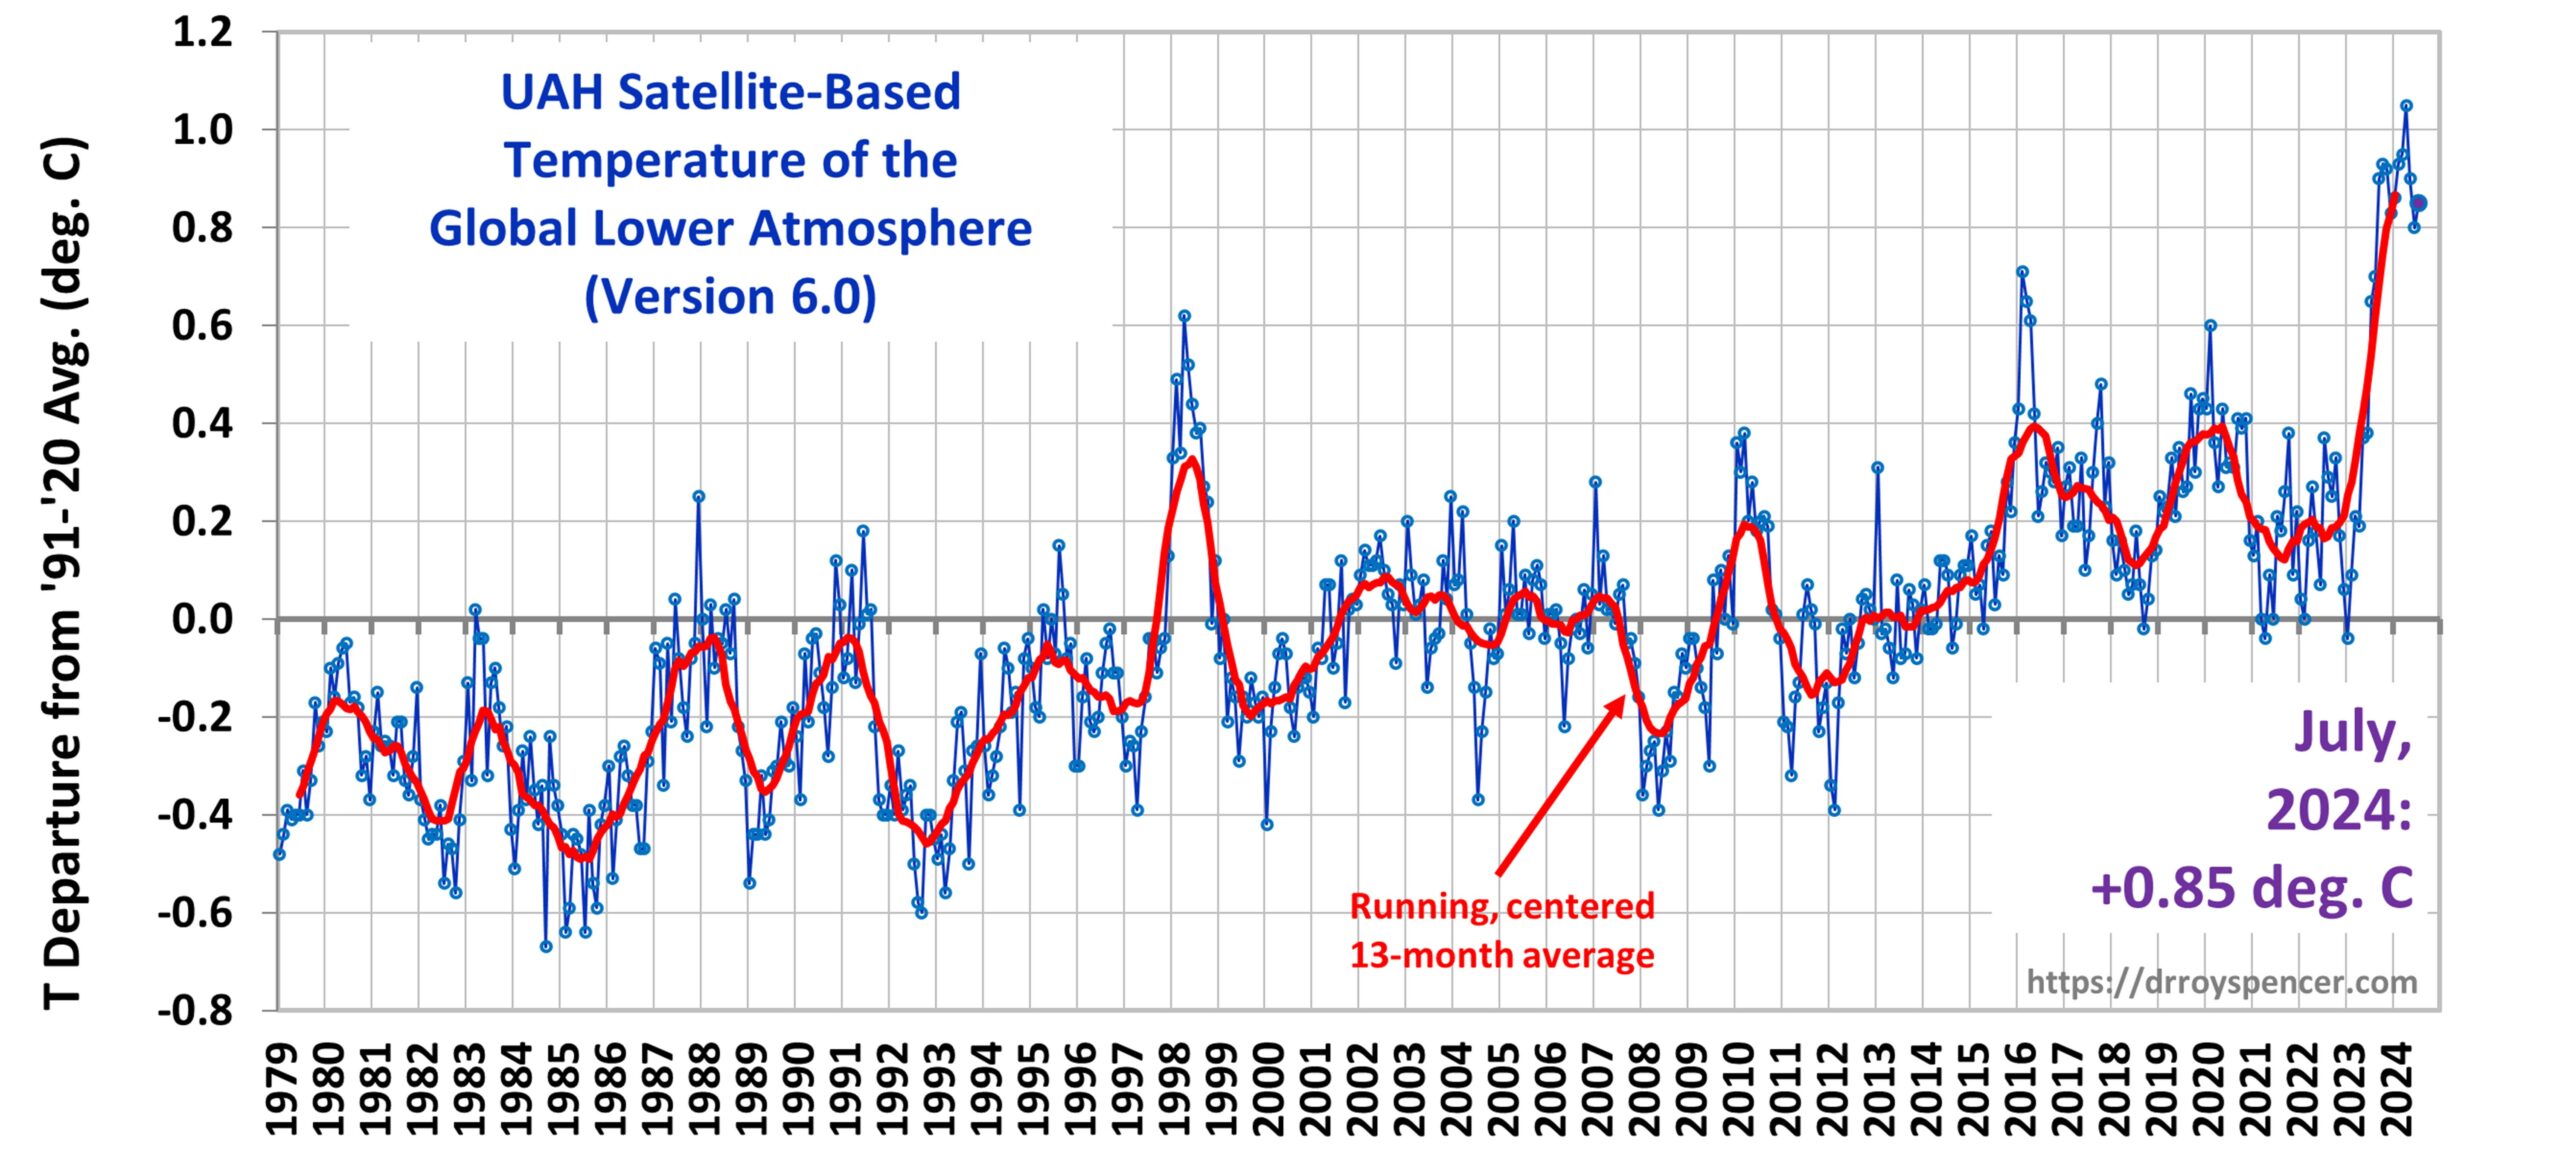
July 2024 Global Satellite Temperature Anomaly Up A Bit (plus an update on the prop bet)

From Dr. Roy Spencer at the University of Alabama-Huntsville, August 1:

UAH Global Temperature Update for July, 2024: +0.85 deg. C
August 1st, 2024  

The Version 6 global average lower tropospheric temperature (LT) anomaly for July, 2024 was +0.85 deg. C departure from the 1991-2020 mean, up from the June, 2024 anomaly of +0.80 deg. C.

https://www.drroyspencer.com/wp-content/uploads/UAH_LT_1979_thru_July_2024_v6_20x9-scaled.jpg

....MUCH MORE

The bet saga thus far:

From May 5's "UAH Global Temperature Update: April Sees New High Temperature Anomaly For The Satellite Era":

Great, just effin' great. I had to go shooting my mouth off with a prop bet on May 2, couldn't wait for the new number to be released, no sirree, had to be posted when the memory to post it was triggered:

Here's a prop bet for you. By May 15, 2026 we will see the satellite-measured -inferred global lower atmospheric temperature anomaly decline by at least 1/2 degree C.

The two keepers of the satellite record are Remote Sensing Systems in Santa Rosa CA and the University of Alabama-Huntsville.

Here's the temperature graph from UAH:....

****
and repeated: "Again the baseline for the prop bet: the above 'Latest Global Temp. Anomaly (March '24: +0.95°C)'" 

Well here's Roy Spencer, PhD from the University of Alabama-Huntsville at his personal site, later on that same day that shall live in infamy, May 2, 2024:

UAH Global Temperature Update for April, 2024: +1.05 deg. C....

June 5
UAH Global Temperature Update: May Sees Temperature Anomaly Come Down A Bit
The University of Alabama-Huntsville is one of the two keepers of the satellite temperature record (along with Remote Sensing Systems). Here's UAH's Dr. Roy Spencer with the update and our adventures in prop bets after the jump.
July 3
Latest Global Average Tropospheric Temperature Anomaly Comes Down A Little Bit More (plus the prop bet, month 3)

Wednesday, July 3, 2024

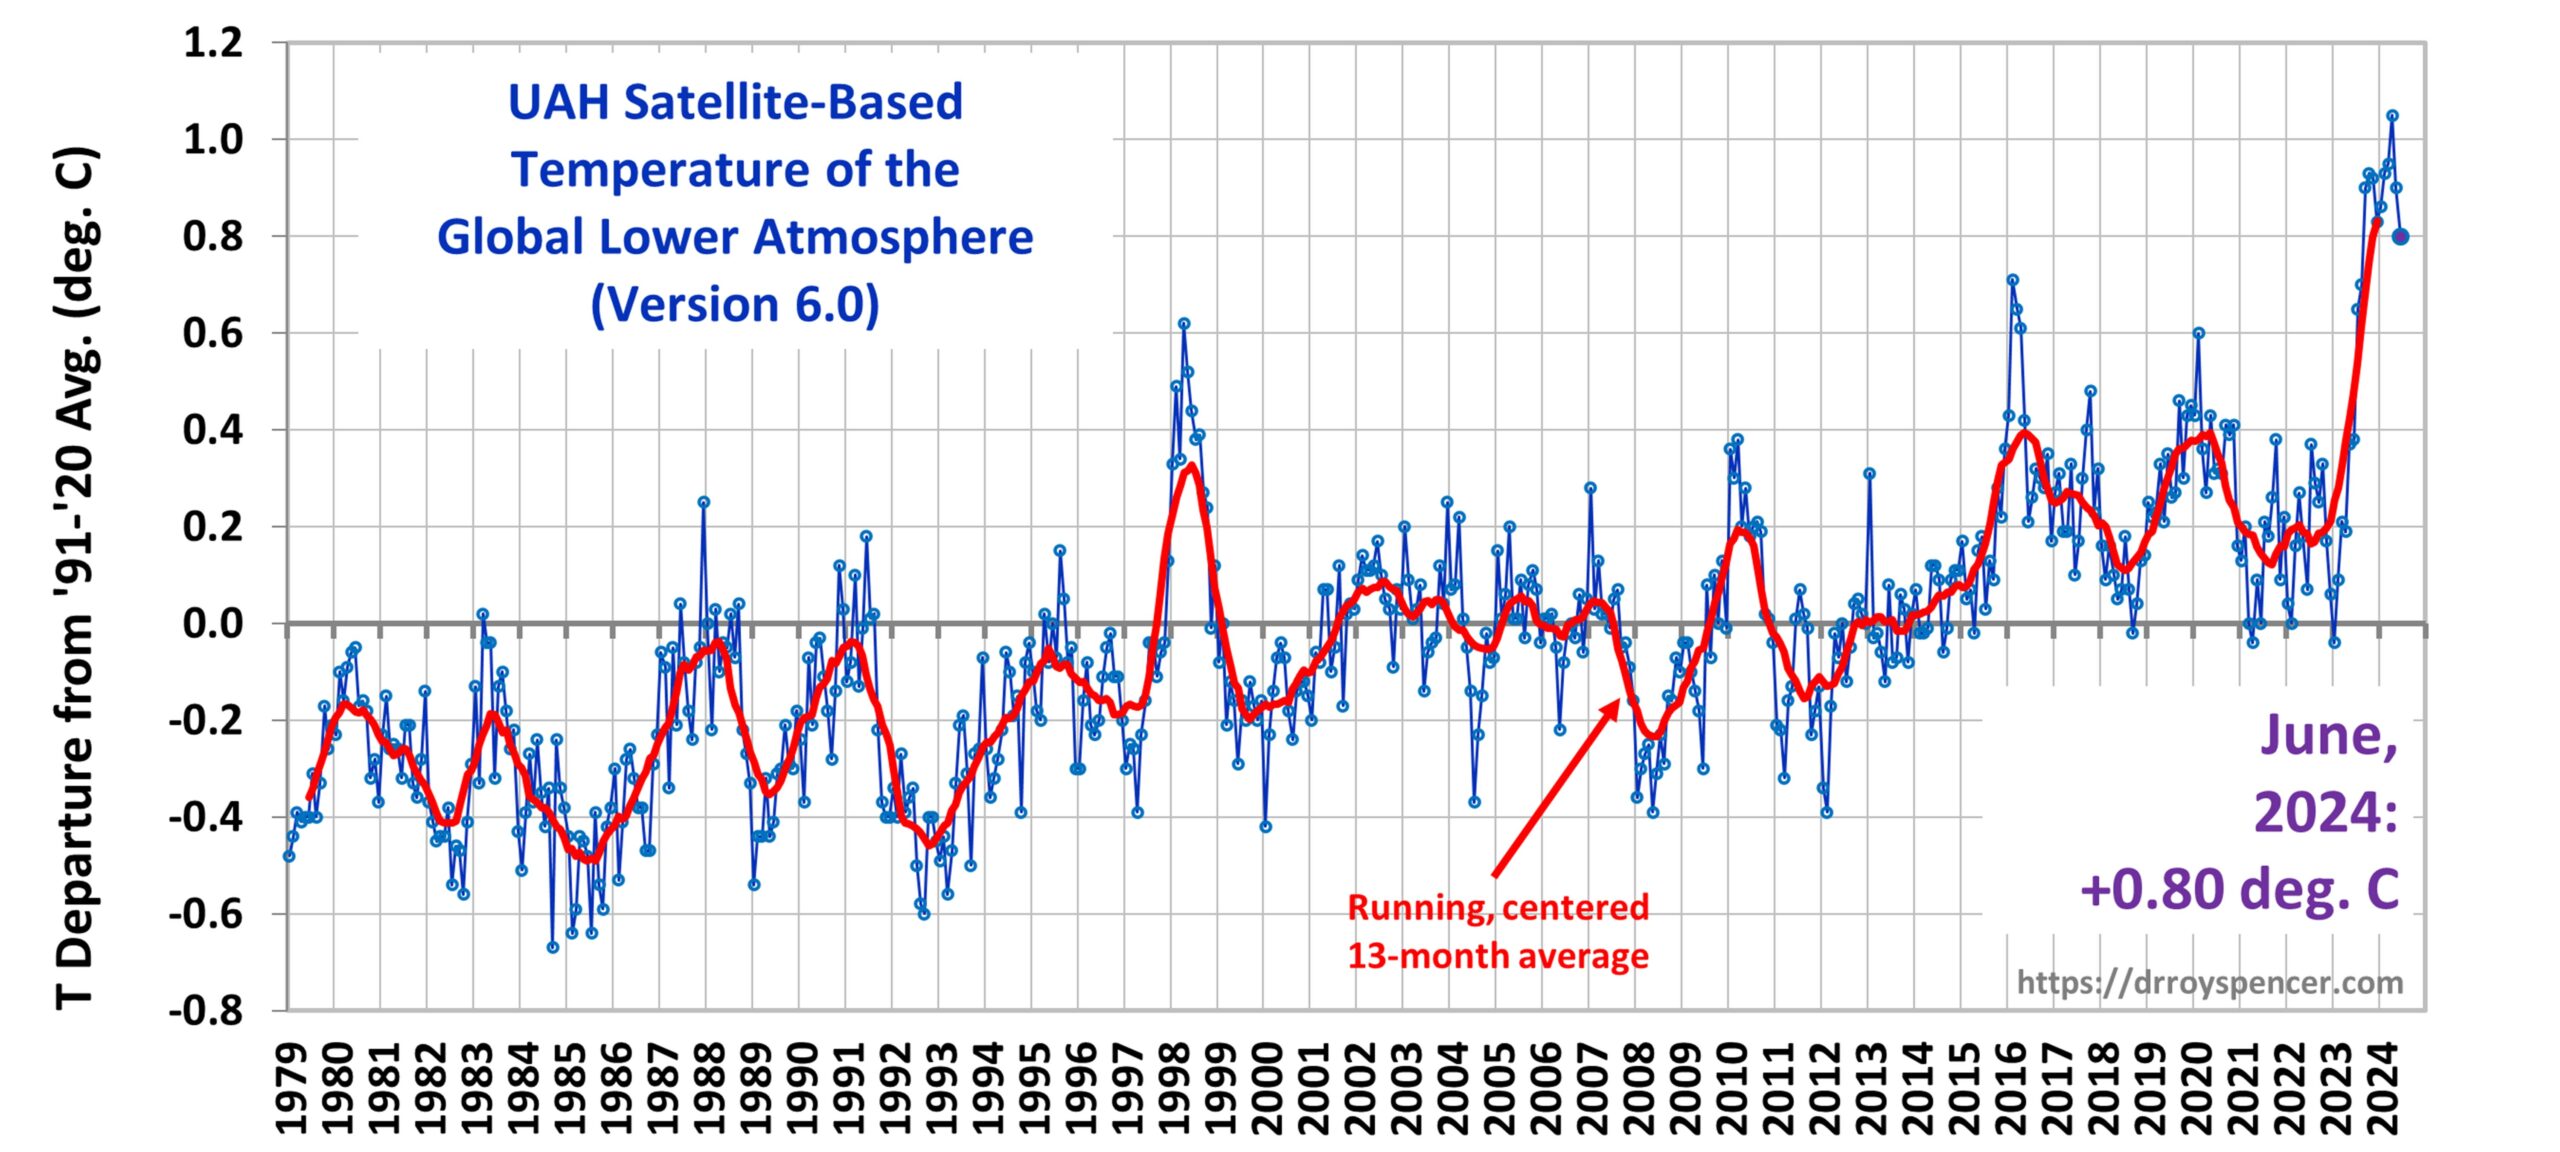
Latest Global Average Tropospheric Temperature Anomaly Comes Down A Little Bit More (plus the prop bet, month 3)

From Doctor Roy Spencer at the University of Alabama-Huntsville, July 2:

Latest Global Average Tropospheric Temperatures

Since 1979, NOAA satellites have been carrying instruments which measure the natural microwave thermal emissions from oxygen in the atmosphere. The intensity of the signals these microwave radiometers measure at different microwave frequencies is directly proportional to the temperature of different, deep layers of the atmosphere. Every month, John Christy and I update global temperature datasets that represent the piecing together of the temperature data from a total of fifteen instruments flying on different satellites over the years. A discussion of the latest version (6.0) of the dataset is located here.

The graph above represents the latest update; updates are usually made within the first week of every month. Contrary to some reports, the satellite measurements are not calibrated in any way with the global surface-based thermometer records of temperature. They instead use their own on-board precision redundant platinum resistance thermometers (PRTs) calibrated to a laboratory reference standard before launch.

The digital data for the above plot, as well as for various sub-regions of the Earth and for three other atmospheric layers, are available at the links below....

....MORE

The bet thus far:

May 2, 2024:

"Major eruption at Ruang volcano, ash to 19.2 km (63 000 feet) a.s.l., Indonesia"

Here's a prop bet for you. By May 15, 2026 we will see the satellite-measured -inferred global lower atmospheric temperature anomaly decline by at least 1/2 degree C.

The two keepers of the satellite record are Remote Sensing Systems in Santa Rosa CA and the University of Alabama-Huntsville. 

Here's the temperature graph from UAH:....

....Again the baseline for the prop bet: the above "Latest Global Temp. Anomaly (March '24: +0.95°C)"....

May 5, 2024:

UAH Global Temperature Update: April Sees New High Temperature Anomaly For The Satellite Era

Great, just effin' great. I had to go shooting my mouth off with a prop bet on May 2, couldn't wait for the new number to be released, no sirree, had to be posted when the memory to post it was triggered:...

.... UAH Global Temperature Update for April, 2024: +1.05 deg. C....

June 5:

UAH Global Temperature Update: May Sees Temperature Anomaly Come Down A Bit

The University of Alabama-Huntsville is one of the two keepers of the satellite temperature record (along with Remote Sensing Systems). Here's UAH's Dr. Roy Spencer with the update and our adventures in prop bets after the jump.

UAH Global Temperature Update for May, 2024: +0.90 deg. C

And July 2, above:

UAH Global Temperature Update for June, 2024:+0.80°C

Wednesday, June 5, 2024

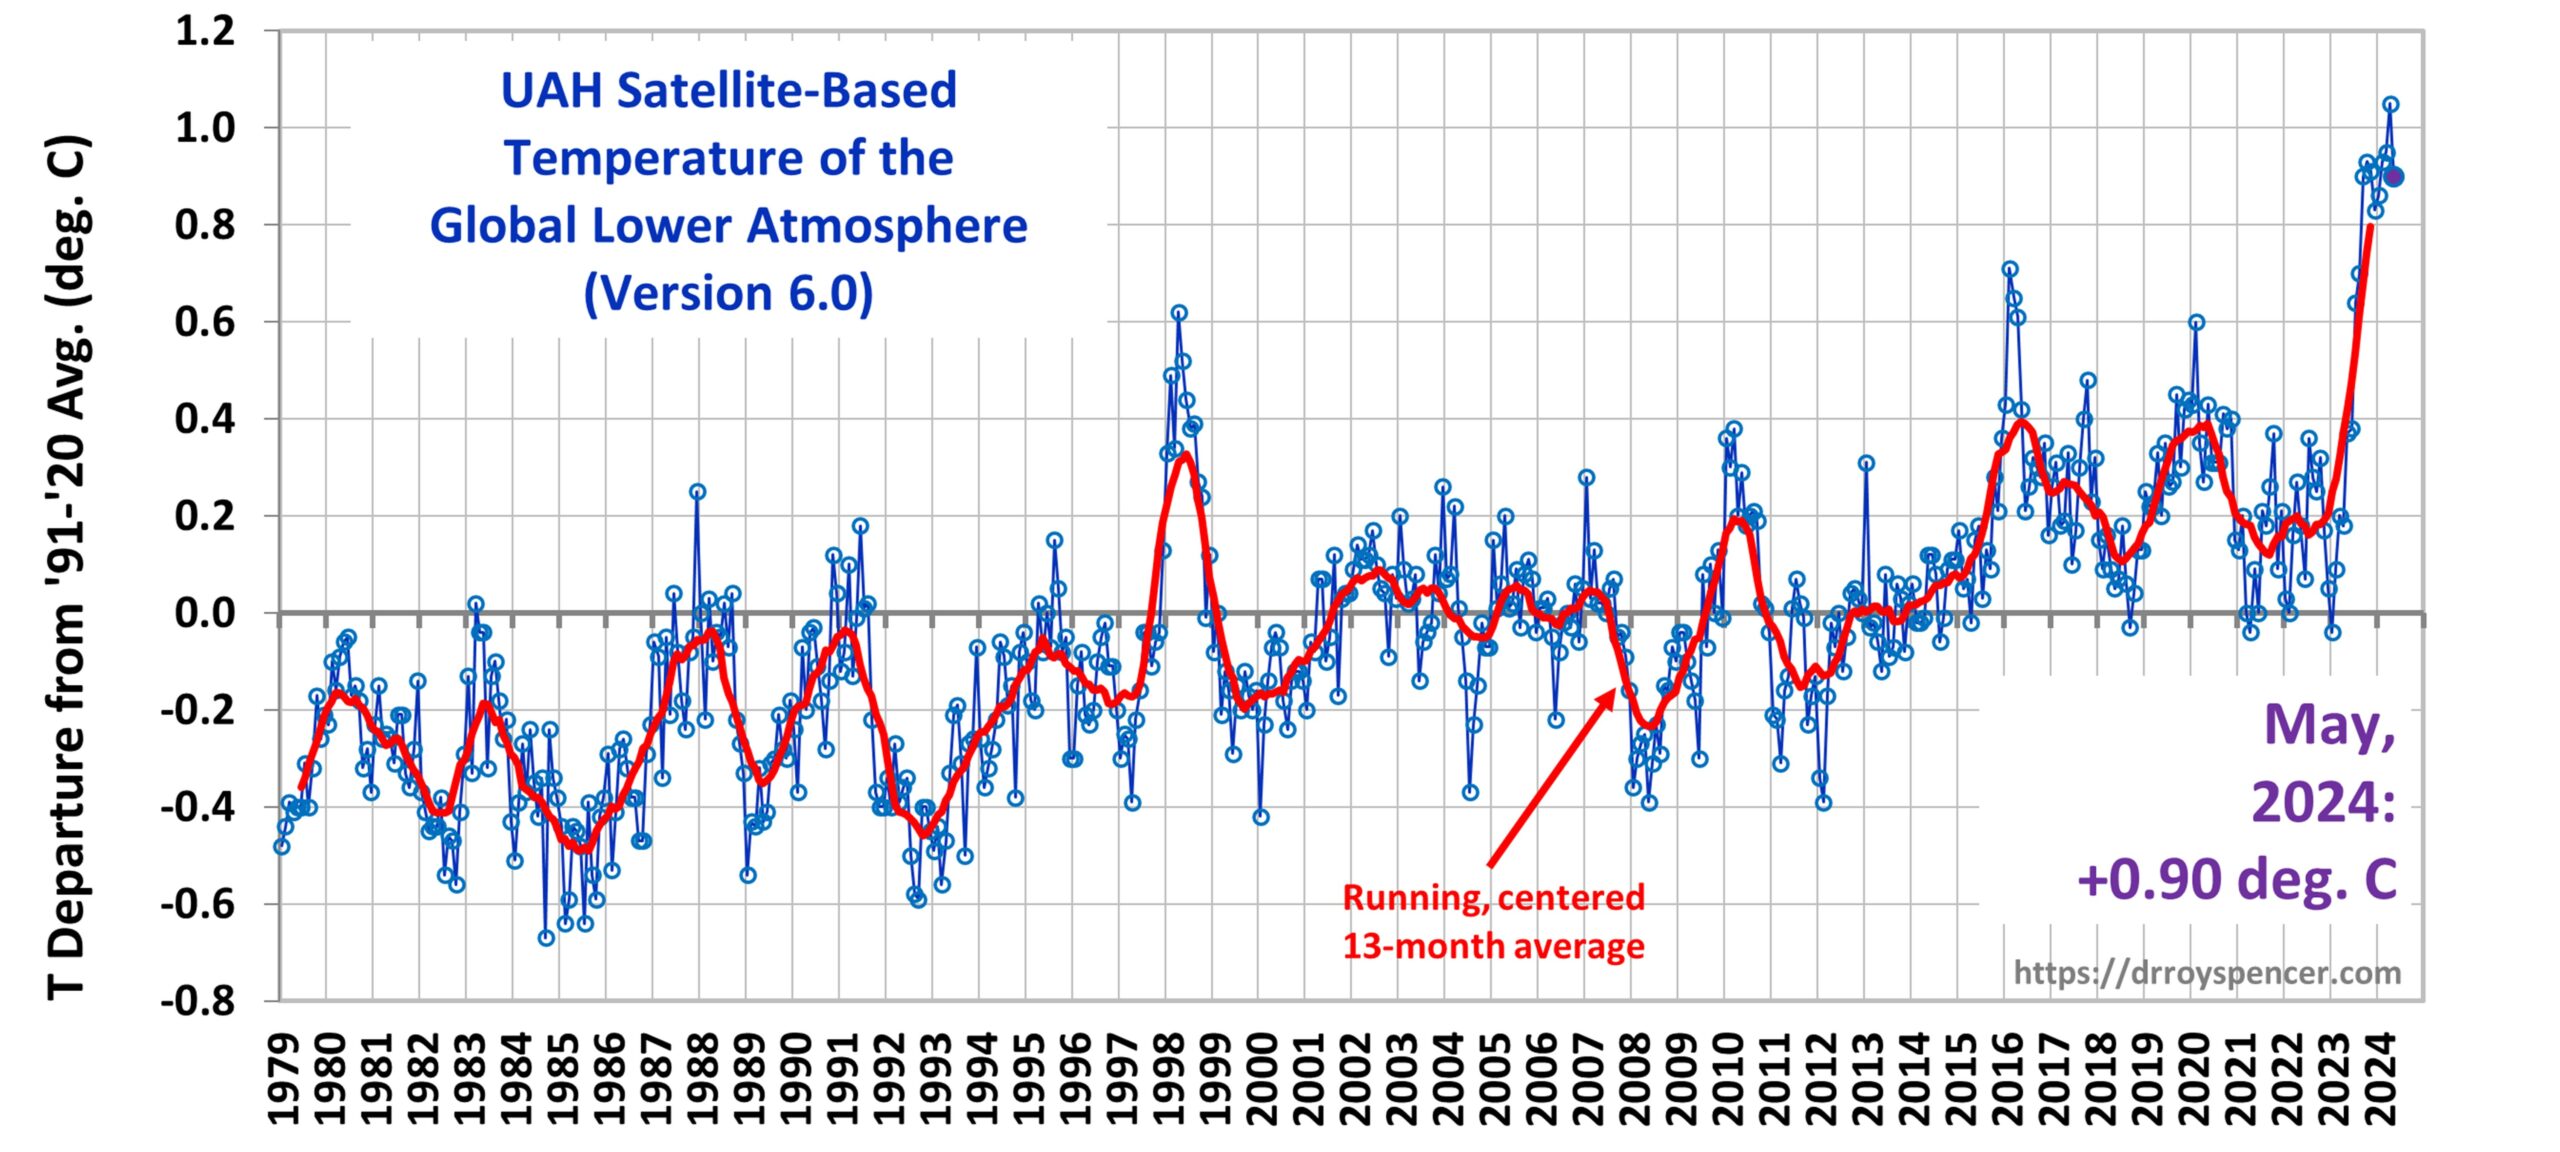
UAH Global Temperature Update: May Sees Temperature Anomaly Come Down A Bit

The University of Alabama-Huntsville is one of the two keepers of the satellite temperature record (along with Remote Sensing Systems). Here's UAH's Dr. Roy Spencer with the update and our adventures in prop bets after the jump.

UAH Global Temperature Update for May, 2024: +0.90 deg. C

June 4th, 2024

The Version 6 global average lower tropospheric temperature (LT) anomaly for May, 2024 was +0.90 deg. C departure from the 1991-2020 mean, down from the record-high April, 2024 anomaly of +1.05 deg. C.


The linear warming trend since January, 1979 remains at +0.15 C/decade (+0.13 C/decade over the global-averaged oceans, and +0.20 C/decade over global-averaged land).

The following table lists various regional LT departures from the 30-year (1991-2020) average for the last 17 months (record highs are in red)....

....MUCH MORE

From May 5's "UAH Global Temperature Update: April Sees New High Temperature Anomaly For The Satellite Era":

Great, just effin' great. I had to go shooting my mouth off with a prop bet on May 2, couldn't wait for the new number to be released, no sirree, had to be posted when the memory to post it was triggered:

Here's a prop bet for you. By May 15, 2026 we will see the satellite-measured -inferred global lower atmospheric temperature anomaly decline by at least 1/2 degree C.

The two keepers of the satellite record are Remote Sensing Systems in Santa Rosa CA and the University of Alabama-Huntsville.

Here's the temperature graph from UAH:....

****
and repeated: "Again the baseline for the prop bet: the above 'Latest Global Temp. Anomaly (March '24: +0.95°C)'" 

Well here's Roy Spencer, PhD from the University of Alabama-Huntsville at his personal site, later on that same day that shall live in infamy, May 2, 2024:

UAH Global Temperature Update for April, 2024: +1.05 deg. C....

Sunday, May 5, 2024

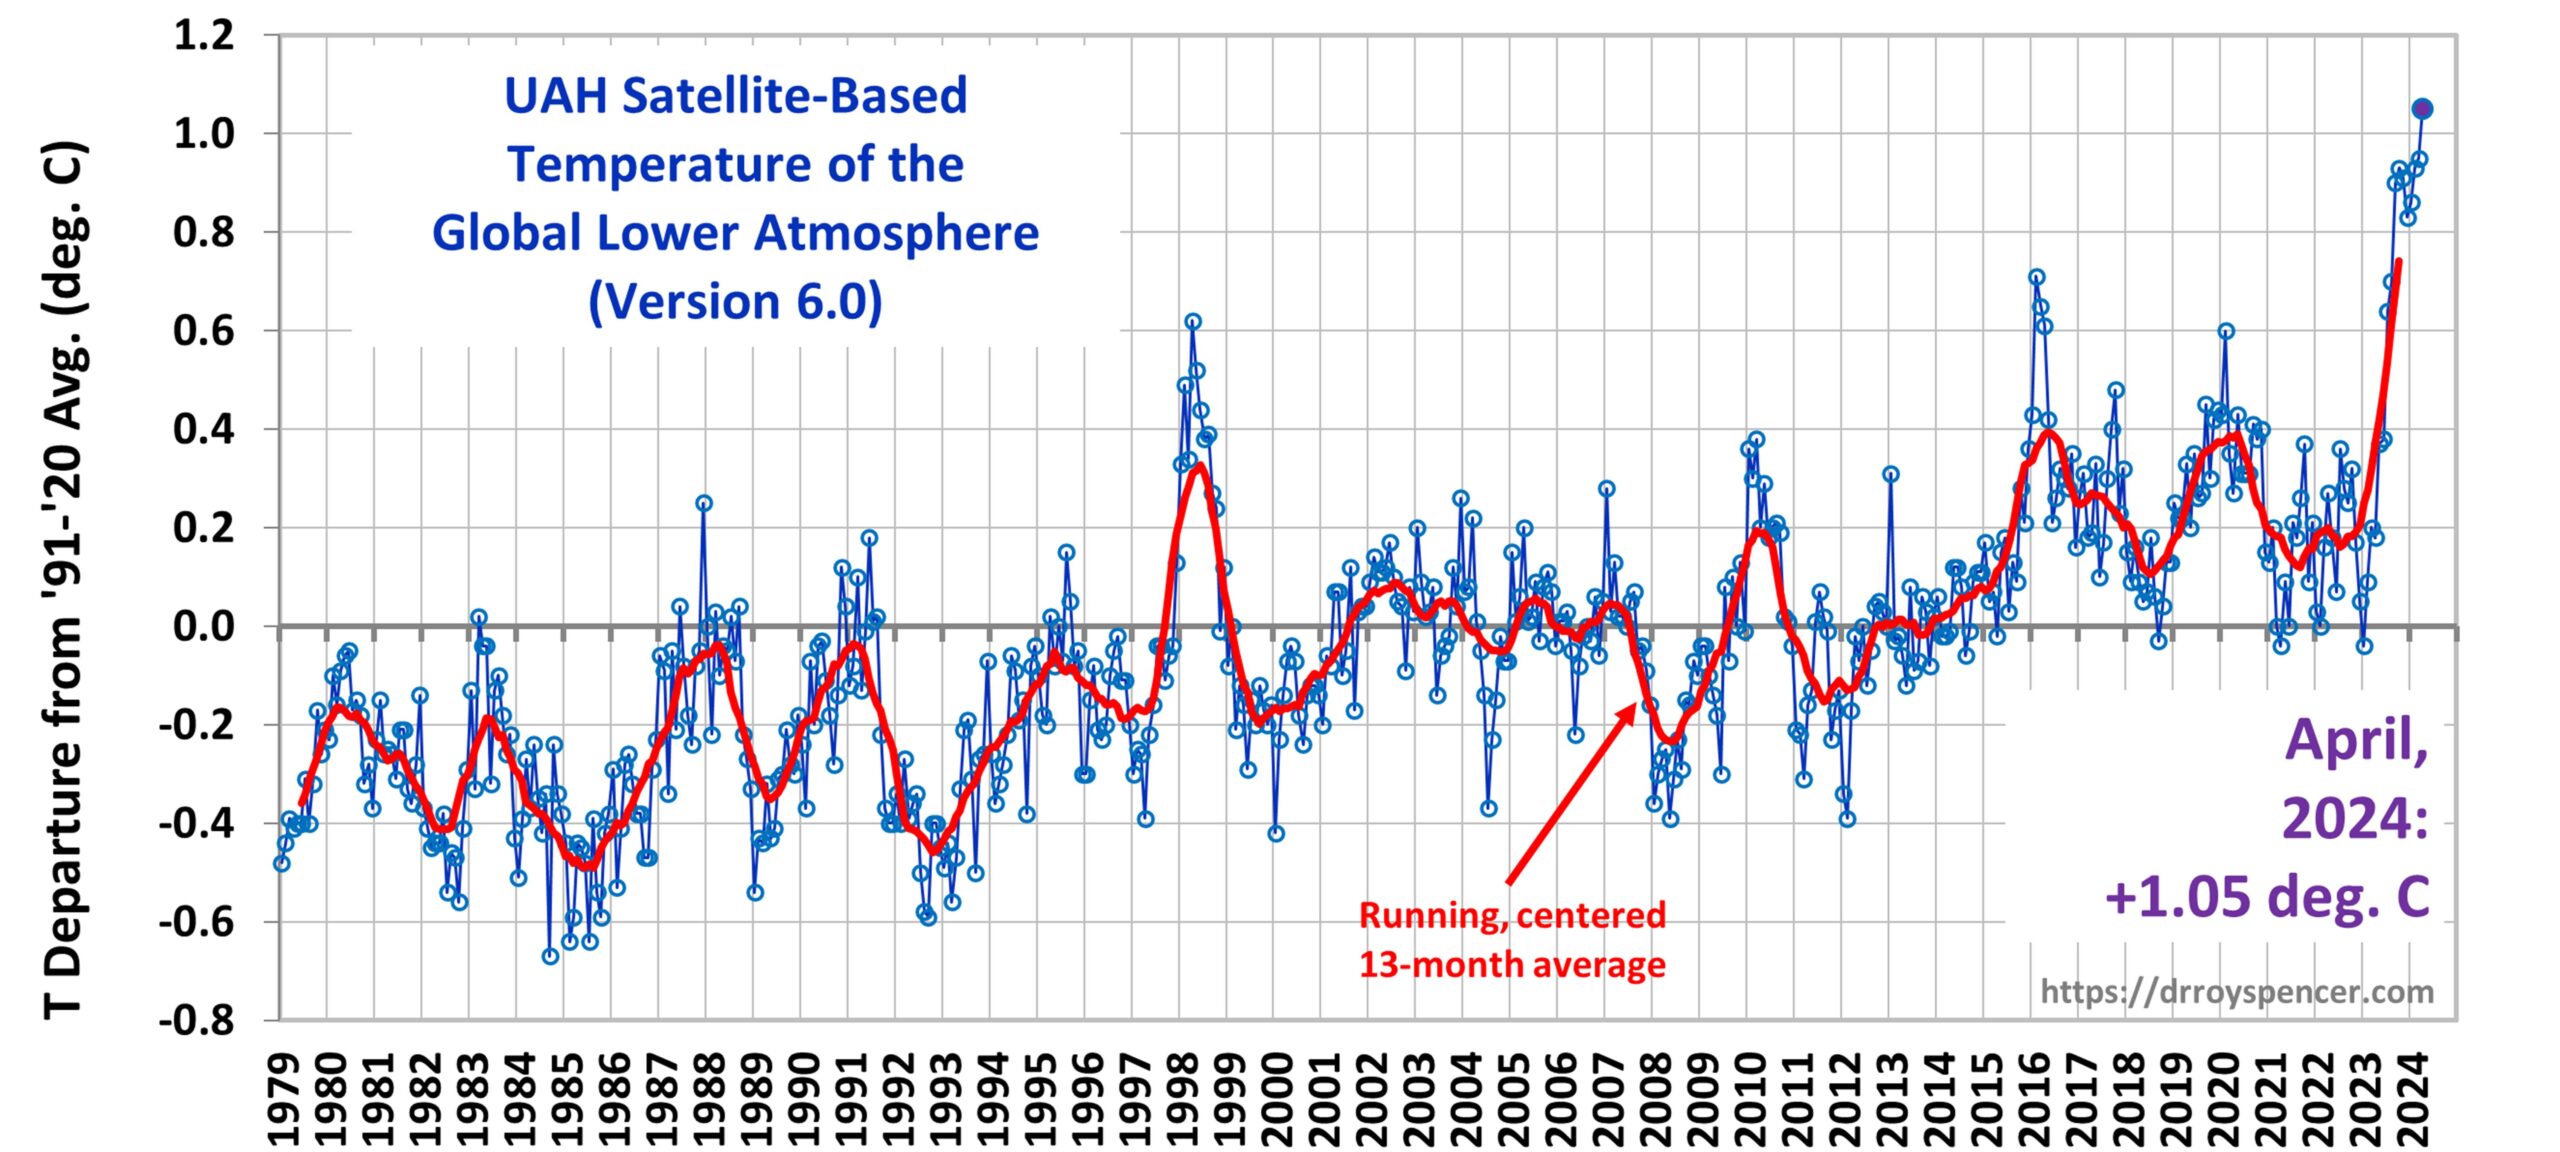
UAH Global Temperature Update: April Sees New High Temperature Anomaly For The Satellite Era

Great, just effin' great. I had to go shooting my mouth off with a prop bet on May 2, couldn't wait for the new number to be released, no sirree, had to be posted when the memory to post it was triggered:

Here's a prop bet for you. By May 15, 2026 we will see the satellite-measured -inferred global lower atmospheric temperature anomaly decline by at least 1/2 degree C.

The two keepers of the satellite record are Remote Sensing Systems in Santa Rosa CA and the University of Alabama-Huntsville.

Here's the temperature graph from UAH:....

****
and repeated: "Again the baseline for the prop bet: the above 'Latest Global Temp. Anomaly (March '24: +0.95°C)'" 

Well here's Roy Spencer, PhD from the University of Alabama-Huntsville at his personal site, later on that same day that shall live in infamy, May 2, 2024:

UAH Global Temperature Update for April, 2024: +1.05 deg. C

May 2nd, 2024

The Version 6 global average lower tropospheric temperature (LT) anomaly for April, 2024 was +1.05 deg. C departure from the 1991-2020 mean, up from the March, 2024 anomaly of +0.95 deg. C, and setting a new high monthly anomaly record for the 1979-2024 satellite period.


The linear warming trend since January, 1979 remains at +0.15 C/decade (+0.13 C/decade over the global-averaged oceans, and +0.20 C/decade over global-averaged land).

It should be noted that the CDAS surface temperature anomaly has been falling in recent months (+0.71, +0.60, +0.53, +0.52 deg. C over the last four months), while the satellite deep-layer atmospheric temperature has been rising. This is usually an indication of extra heat being lost by the surface to the deep-troposphere through convection, and is what is expected due to the waning El Nino event. I suspect next month’s tropospheric temperature will fall as a result.

The following table lists various regional LT departures from the 30-year (1991-2020) average for the last 16 months (record highs are in red):....

....MORE

As the old-time stock traders used to say, "Well bought is half sold" meaning you entry price on a bet can be key to its success. And now I have to overcome a full 1/10 degree C self-imposed handicap. Aarrggh.

And, just to make things more interesting, the proposed temperature decline was one of the factors that led to me thinking I was some sort of Thales of Miletus with: "Trading The Olive Oil Market With Derivatives."

And, as the usurer said, "If you want to make time fly by take out a 90-day note." Or propose a bet two years and ten days hence when all the best climatologists make their forecasts for the year 2100, far enough out for most of those folks who heard the original pronouncement to have moved on or passed on.

Thursday, May 2, 2024

"Major eruption at Ruang volcano, ash to 19.2 km (63 000 feet) a.s.l., Indonesia"

Here's a prop bet for you. By May 15, 2026 we will see the satellite-measured -inferred global lower atmospheric temperature anomaly decline by at least 1/2 degree C.

The two keepers of the satellite record are Remote Sensing Systems in Santa Rosa CA and the University of Alabama-Huntsville. 

Here's the temperature graph from UAH:


https://www.drroyspencer.com/wp-content/uploads/UAH_LT_1979_thru_March_2024_v6_20x9.jpg

And here is one of the keepers of the numbers, Roy Spencer, PhD. on the background of the graph:

Since 1979, NOAA satellites have been carrying instruments which measure the natural microwave thermal emissions from oxygen in the atmosphere. The intensity of the signals these microwave radiometers measure at different microwave frequencies is directly proportional to the temperature of different, deep layers of the atmosphere. Every month, John Christy and I update global temperature datasets that represent the piecing together of the temperature data from a total of fifteen instruments flying on different satellites over the years. A discussion of the latest version (6.0) of the dataset is located here.

The graph above represents the latest update; updates are usually made within the first week of every month. Contrary to some reports, the satellite measurements are not calibrated in any way with the global surface-based thermometer records of temperature. They instead use their own on-board precision redundant platinum resistance thermometers (PRTs) calibrated to a laboratory reference standard before launch.

The digital data for the above plot, as well as for various sub-regions of the Earth and for three other atmospheric layers, are available at the links below. You can copy and paste the data into a spreadsheet program like Excel to do your own plotting and analysis (in Excel, you might need to use the “Data>Text to Columns” function to get the data separated into columns after pasting):

Lower Troposphere: http://vortex.nsstc.uah.edu/data/msu/v6.0/tlt/uahncdc_lt_6.0.txt
Mid-Troposphere: http://vortex.nsstc.uah.edu/data/msu/v6.0/tmt/uahncdc_mt_6.0.txt
Tropopause: http://vortex.nsstc.uah.edu/data/msu/v6.0/ttp/uahncdc_tp_6.0.txt
Lower Stratosphere: http://vortex.nsstc.uah.edu/data/msu/v6.0/tls/uahncdc_ls_6.0.txt

Again the baseline for the prop bet: the above "Latest Global Temp. Anomaly (March '24: +0.95°C)"

And now, not really related because the aerosols didn't get injected high enough, just reaching the lower boundary of the tropical stratosphere (~20 km), but posted because it reminded me to declare the proposition, from The Watchers, April 30:

Another high-level eruption started at Indonesia’s Ruang volcano at 18:15 UTC on April 29, 2024 (01:15 LT, April 30), producing an ash column to an estimated height of about 19.2 km (63 000 feet) above sea level. Authorities raised the Alert Level to 4 and the Aviation Color Code to Red. This powerful eruption comes just 2 weeks after a similar eruption on April 16.

This intense volcanic eruption was characterized by the dramatic emission of incandescent lava that soared into the sky, illuminating it with a bright red hue. This spectacular display was further enhanced by the presence of volcanic lightning, a phenomenon associated with the eruption of ash-laden plumes into the atmosphere. Such visual manifestations are typical signs of significant volcanic activity, indicating the release of vast amounts of energy and material from within the Earth.

Concurrently, a significant shower of stones and gravel occurred, extending over a broader area than during the previous eruption on April 16. This widespread fallout is indicative of the eruption’s intensity and its capacity to disperse material over a large radius....

....MUCH MORE, including some impressive pictures.

Sunday, December 16, 2018

A Culture of Chance, A Nation of Chancers

From Cabinet Magazine:

Rolling the Dice: An Interview with Jackson Lears

In late spring 2005, the online gaming empi­re known as PartyGaming— home of the wildly lucrative website PartyPoker.com—announced that it would take its company public on the London stock market. Speculators predicted that, on the open market, PartyGaming would be valued at over $10 billion, just a few poker chips less than the value attributed to the venerable British department store chain Marks & Spencer. Despite historic attempts to control or marginalize games of chance as a socially disreputable practice, the multibillion-dollar gambling industry in both its virtual and physical incarnations—from online poker websites to lottery tickets and off-track betting parlors to suburban casinos and the emergence of Las Vegas as a cultural capital—seems to have never been stronger or more resilient.

In his recent book Something for Nothing: Luck in America (2003), Jackson Lears, the Board of Governors Professor of History at Rutgers University and the editor-in-chief of Raritan, asserts that gambling is a central component of contemporary culture. Lears argues that this is not because Americans are a nation of gamblers per se, but because gambling is a modern distillation of what can best be described as a “culture of chance.” For Lears, the concept of chance and its various metaphysical siblings Luck, Fortune, and Grace have profoundly influenced American life in everything from personal expression to social policy. With the rise of the market economy in the early nineteenth century, Lears argues, the culture of chance has fought tooth and nail for survival against the rational appeals of a “culture of control.”

The divinatory dimensions of chance through which Americans experienced the world, as embodied in games of luck and skill and as practiced by the confidence man and gambler, were transmuted into rational systems of forecasting and speculation practiced by the stockbroker and day trader. Trying to predict the future while trying to maintain control, Lears suggests, remains a ritualized component of both religious and secular cultures. The gambler’s dice, the soothsayer’s bones, the fortune-teller’s tea leaves, and the financier’s econometric charts are more closely aligned than we’ve been led to believe. David Serlin spoke with Lears by phone in June 2005.

Cabinet: How did you become interested in the study of chance or, as you call it in your book, the “culture of chance”?

Jackson Lears: There were a lot of different streams that came together in this book. Since my first book, No Place of Grace, I have thought seriously about the cultural longing for transcendence that survived the economic rationality of the nineteenth century. I perceived that there was some kind of longing for grace that animated the impulse to gamble, and once I had hit on that hunch I began to find evidence of it everywhere. I began to see that there were connections between the gambler’s dice and the soothsayer’s bones. The gambler and the diviner were brothers under the skin. This led me to situate gambling in the midst of what I call a culture of chance, which includes all sorts of rituals and practices that use chance as a way of knowing or a way of trying to discern the will of the cosmos, the meaning of the universe, or even—in the case of Calvinist casting of lots—the will of God. The notion of luck is always communicated as an unearned gift, a free gift. Luck, like grace, is something that happens to you. You don’t earn it. To me, this represented a very deep realization at some fundamental level of the futility of striving and trying to control all outcomes, which seems to me at the heart of our dominant culture, whether in religious or secular forms. I began to see gambling and the culture of chance as a kind of counterpoint to this.

The other stream that fed my interest in chance came about while I was on a subway platform in Manhattan. I was waiting in a short line to buy a subway token and noticed that there was a much longer line next to mine, snaking all the way around the platform, for the lottery machine. This was 1994. Newt Gingrich and his buddies had just won a huge victory in Congress, the “Contract with America” was in the air, and there were all sorts of messages directed at Americans to take responsibility for their own economic fate, pull themselves up by their bootstraps, and refuse welfare and other “handouts” that they didn’t deserve. The rhetoric of the self-made man was making a comeback. I looked around at these people waiting in line for the lottery ticket and I thought, these people work hard, but the fact that they’re in this lottery line suggests that they realize, at their core, that hard work is not the whole story. Sometimes you just have to catch a break. And catching a break is basically the secular American version of grace.

Cabinet:  Was this epiphany—seeing working people spending their hard-earned money on lottery tickets—the origin of the distinction that you draw throughout your book between the “culture of chance” and the “culture of control”?

Jackson Lears:  What I wanted to show in this book is that there was, and continues to be, a huge overlap between the culture of control, which relies on some predictability and systematic direction of fate, and the culture of chance, which is much less certain that diligence is the only path to success and is willing sometimes to roll the dice. These two cultures not only overlap, but they interpenetrate each other. One finds some combination of chance and control working together, whether you’re talking about sports or investment or religious faith. Some imagine life as a series of calculated risks, more like a poker game than a lottery, in which people realize that they can’t control all outcomes; but some also want to be able to use their skills to their best advantage, as one does in poker. Yet, at the same time, people recognize that they cannot control all outcomes and that, in the end, luck will play a role as well, and we have to acknowledge its power.

We find this invariable coexistence of chance and control on Wall Street and in the history of speculation. People debate whether or not speculation is mere gambling or whether it’s an investment. Huge sums of money are spent by investment banking firms and brokerage houses to persuade people that, in fact, they aren’t taking a risk when they invest and that they can put their portfolios together in various ways that can minimize if not eliminate risk altogether. Of course, anyone who claims they can eliminate risk ought to be brought up immediately on charges before the U.S. Securities and Exchange Commission.

Cabinet:  Your book describes how the culture of control secularized some of the religious or spiritual elements of chance. So is the oxymoronic concept of the “safe risk” or “safe beta” part of that process of secularization? There’s an unspoken sense that a “safe beta” is not a bet at all; it’s almost a guarantee, such as when aspiring students identify a college as their “safety school.”

Jackson Lears:  That’s one of the paradoxes that we look at every day in the culture of capitalism. On the one hand, there has to be this promise of a magical reward of wealth without work; at the same time, this magic has to be stabilized and rationalized and made to seem predictable in order to cancel out, or threaten to cancel out, the elements of luck and risk. Since the turn of the last century, folks like J.P. Morgan have attempted to make speculative capitalism seem safe and predictable. Of course, this falls apart completely in the Great Depression and only begins to emerge again in the long bull market of the 1980s and 1990s. But there is something quite misleading about the attempt to be reassuring on the subject of risk, to say that what is genuinely a risk is not a risk but is, in fact, a safe option. I’m reminded of the celebrity cowboy Roy Rogers’s farewell to his faithful TV viewers in the 1950s, and it seems to me to be the signature advice of that era: “Be brave, but don’t take chances.” This is a perfectly self-canceling sentence. It says, in effect, “Experience the frisson of bravery, the excitement, the pleasure of feeling like you are doing something heroic. But never bet on anything less than a sure thing.”

Human beings want the excitement of risk, but they also want the safety that comes with containing its worst possibilities. I think that, in some ways, these paired desires capture the dialectic I was trying to get at in my book. The culture of control is not just rooted in a desire to dominate other people and the environment. It is rooted in a desire that is just as natural, I think, and as universal and timeless as the desire for risk and uncertainty and luck, and that’s the desire for stability and predictability....MUCH MORE

Thursday, February 3, 2011

AccuWeather: "Three of Next Five Winters Could be as Cold or Colder"

From AccuWeather:
This winter is on track to become the coldest for the nation as a whole since the 1980s or possibly even the late 1970s. According to AccuWeather.com Chief Long Range Forecaster Joe Bastardi, three or four out of the next five winters could be just as cold, if not colder.

He is worried that next winter, for example, will be colder than this one.
Bastardi adds that with the U.S. in the middle of one of its worst recessions in its history and the price of oil in question, he is extremely concerned about the prospect for more persistent cold weather in the coming years putting increased financial hardship on Americans.

"Cold is a lot worse than warm," Bastardi said, "and that's why your energy bill goes up during the winter time: because of the fact that it takes a lot to heat a house."

While there are many different factors that are playing into Bastardi's forecast, one of the primary drivers is La Niña and the trends that have been observed in winters that follow the onset of a La Niña.

Current La Nina Signals More Cold Winters Ahead
La Niña occurs when sea surface temperatures across the equatorial central and eastern Pacific are below normal. La Niña and its counterpart, El Niño, which occurs when sea surface temperatures of the same region are above normal, have a large influence on the weather patterns that set up across the globe.
The current La Niña, which kicked in this past summer, is unprecedented after becoming the strongest on record in December 2010. Bastardi thinks this La Niña will last into next year, though it will be weaker, and will not disappear completely until 2012.

According to Bastardi, studies over the past 100 years or so show that after the first winter following the onset of a La Niña, the next several winters thereafter tend to be colder than normal in the U.S.
He says the first winter during a La Niña tends to be warm. The next winter that follows is usually less warm, and the winter after that is usually cold.

"There's a natural tendency for that to happen because of the large-scale factors," Bastardi commented. "What's interesting about what we're seeing here is that [the current La Niña] is starting so cold."
Temperatures this winter so far are averaging below normal across much of the eastern two-thirds of the country.

He adds, "If the past predicts the future, then the first year La Niña is warmer than the combination of the following two."

He said that with the exception of the winters of 1916-1917 and 1917-1918, the first year of every moderate or stronger La Niña available for study has featured a warmer-than-normal winter from the Plains eastward. This winter, it has been colder than normal.

Taking a look at one of the exceptions, the La Niña winter of 1916-1917, colder-than-normal conditions were observed across the northern part of the Plains and East (not the South). Bastardi said that never before have colder-than-normal conditions been observed across the South during a first-year La Niña winter, as has been the case this winter.

If this winter, which has been colder than normal across the eastern two-thirds of the country, is historically supposed to be the warmest of the next three winters for the U.S., according to Bastardi, we have some frigid times ahead....MORE
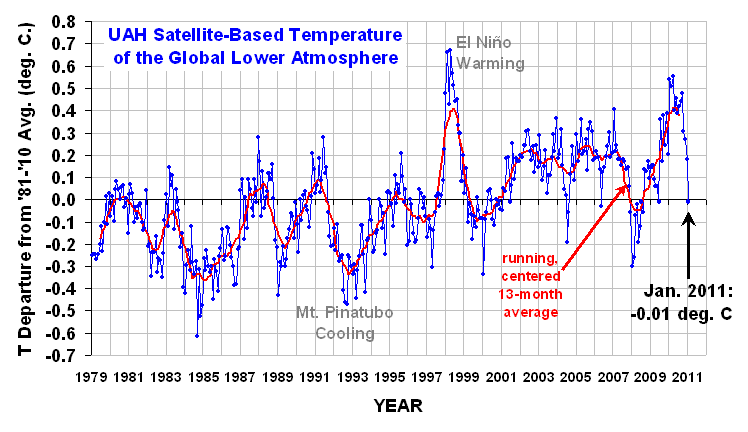
Here's the latest satellite measure of the earth's temperature anomaly from one of the keepers of the records at the University of Alabama-Huntsville, Dr. Roy Spencer:

…although this, too, shall pass, when La Nina goes away.

UAH_LT_1979_thru_Jan_2011