Here's a prop bet for you. By May 15, 2026 we will see the satellite-measured -inferred global lower atmospheric temperature anomaly decline by at least 1/2 degree C.
The two keepers of the satellite record are Remote Sensing Systems in Santa Rosa CA and the University of Alabama-Huntsville.
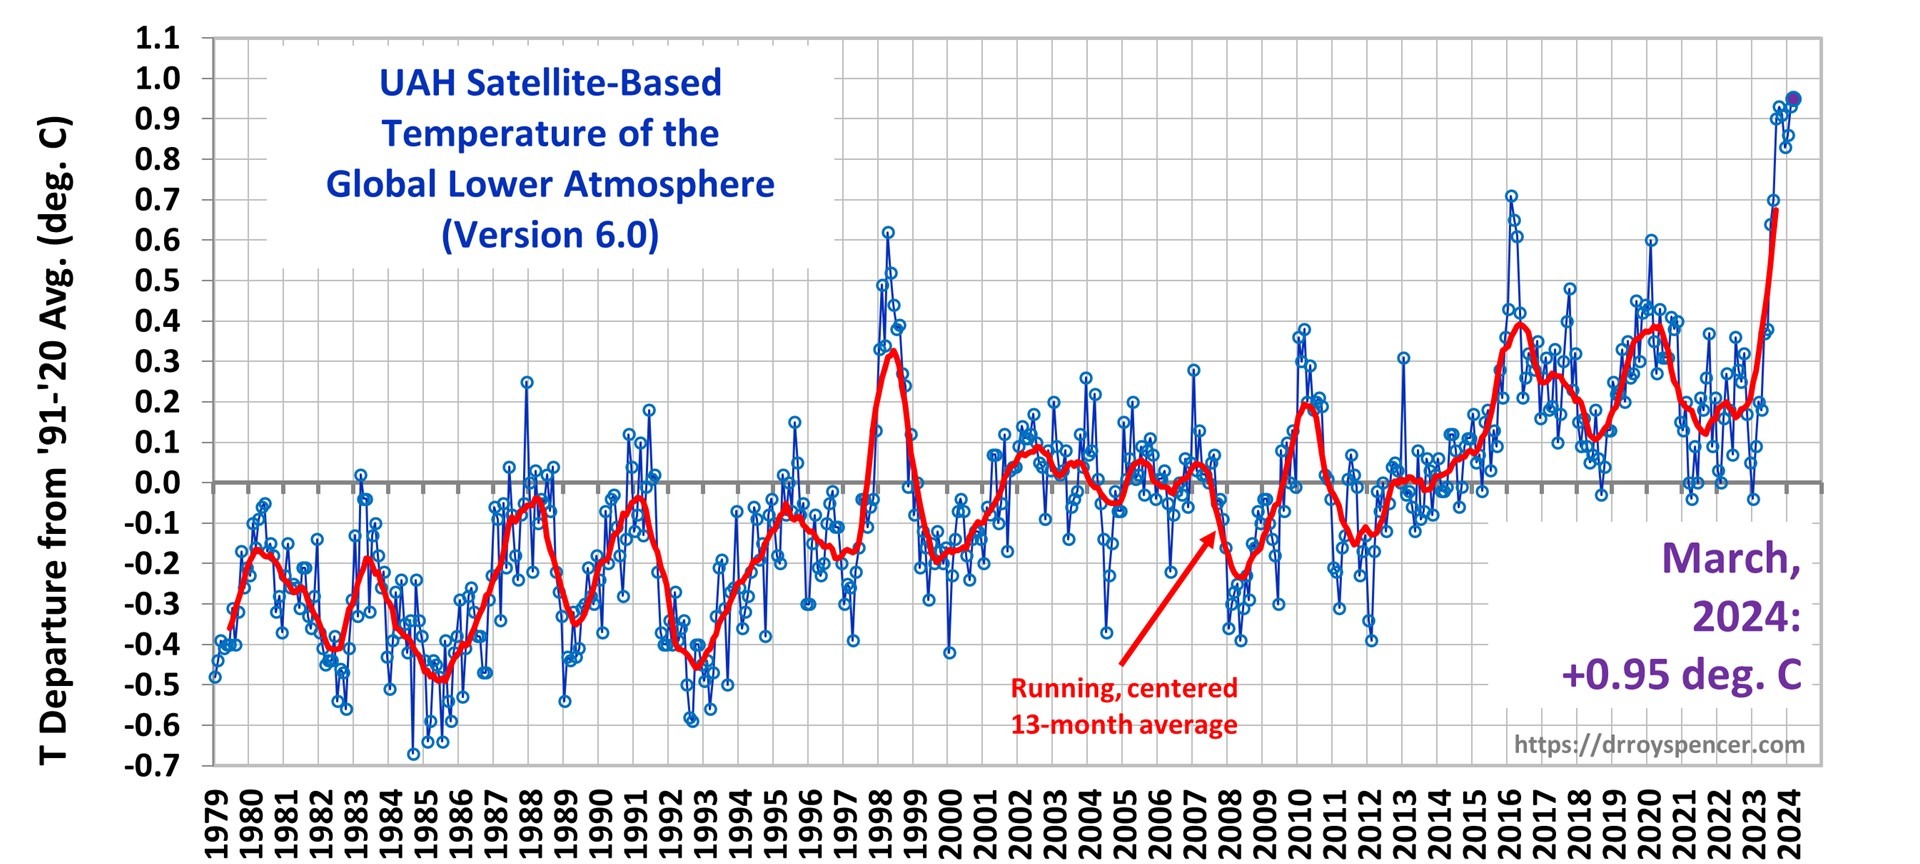
Here's the temperature graph from UAH:
And here is one of the keepers of the numbers, Roy Spencer, PhD. on the background of the graph:
Since 1979, NOAA satellites have been carrying instruments which measure the natural microwave thermal emissions from oxygen in the atmosphere. The intensity of the signals these microwave radiometers measure at different microwave frequencies is directly proportional to the temperature of different, deep layers of the atmosphere. Every month, John Christy and I update global temperature datasets that represent the piecing together of the temperature data from a total of fifteen instruments flying on different satellites over the years. A discussion of the latest version (6.0) of the dataset is located here.
The graph above represents the latest update; updates are usually made within the first week of every month. Contrary to some reports, the satellite measurements are not calibrated in any way with the global surface-based thermometer records of temperature. They instead use their own on-board precision redundant platinum resistance thermometers (PRTs) calibrated to a laboratory reference standard before launch.
The digital data for the above plot, as well as for various sub-regions of the Earth and for three other atmospheric layers, are available at the links below. You can copy and paste the data into a spreadsheet program like Excel to do your own plotting and analysis (in Excel, you might need to use the “Data>Text to Columns” function to get the data separated into columns after pasting):
Lower Troposphere: http://vortex.nsstc.uah.edu/data/msu/v6.0/tlt/uahncdc_lt_6.0.txt
Mid-Troposphere: http://vortex.nsstc.uah.edu/data/msu/v6.0/tmt/uahncdc_mt_6.0.txt
Tropopause: http://vortex.nsstc.uah.edu/data/msu/v6.0/ttp/uahncdc_tp_6.0.txt
Lower Stratosphere: http://vortex.nsstc.uah.edu/data/msu/v6.0/tls/uahncdc_ls_6.0.txt
Again the baseline for the prop bet: the above "Latest Global Temp. Anomaly (March '24: +0.95°C)"
And now, not really related because the aerosols didn't get injected high enough, just reaching the lower boundary of the tropical stratosphere (~20 km), but posted because it reminded me to declare the proposition, from The Watchers, April 30:
Another high-level eruption started at Indonesia’s Ruang volcano at 18:15 UTC on April 29, 2024 (01:15 LT, April 30), producing an ash column to an estimated height of about 19.2 km (63 000 feet) above sea level. Authorities raised the Alert Level to 4 and the Aviation Color Code to Red. This powerful eruption comes just 2 weeks after a similar eruption on April 16.
This intense volcanic eruption was characterized by the dramatic emission of incandescent lava that soared into the sky, illuminating it with a bright red hue. This spectacular display was further enhanced by the presence of volcanic lightning, a phenomenon associated with the eruption of ash-laden plumes into the atmosphere. Such visual manifestations are typical signs of significant volcanic activity, indicating the release of vast amounts of energy and material from within the Earth.Concurrently, a significant shower of stones and gravel occurred, extending over a broader area than during the previous eruption on April 16. This widespread fallout is indicative of the eruption’s intensity and its capacity to disperse material over a large radius....
....MUCH MORE, including some impressive pictures.