A repost from January 2018:
Our off-the-cuff-answer is on the start of the second decline from an all time high, something along these lines from StockCharts back in 2011:
Revisiting the 2007 S&P 500 Reversal
Although no two market tops are the same, we can get an idea of what a major reversal looks like by examining past reversals. The 2007 top evolved over a 9 month period. There were clear support breaks at 1425 and 1375. RSI broke its bull zone (40 to 80) at the end of December 2007. The ensuing throwback rally retraced 50% and met resistance near broken support.

Here's another example via SNBCHF, the Dow Jones Industrial in 1929:

Do note this chart only takes you to the first week of 1930. The DJIA didn't bottom until July 8, 1932.And from December 2021's "Lest we forget, over five trading days in April 2000 the Nasdaq dropped 25%" a picture of the Nasdaq 100 decline in 2000 - 2002:
At 41.22 (close, 40.56 intraday)
The failure to re-take the highs after the first decline (the right shoulder of an H&S patter) is your clue to be wary.
Keep in mind that in broad based indices you have all kinds of churning around going on, some stocks head down while the index is still rising etc.
Possibly more interesting is this account of ubbly-bubbly parabolic goodness, from Feb. 2012:....
Here's Mt. NDX (Naz100) note the period 1998 to 2002:

Though Professor O. has a South Sea Company stock price chart in his article here is an annotated version:
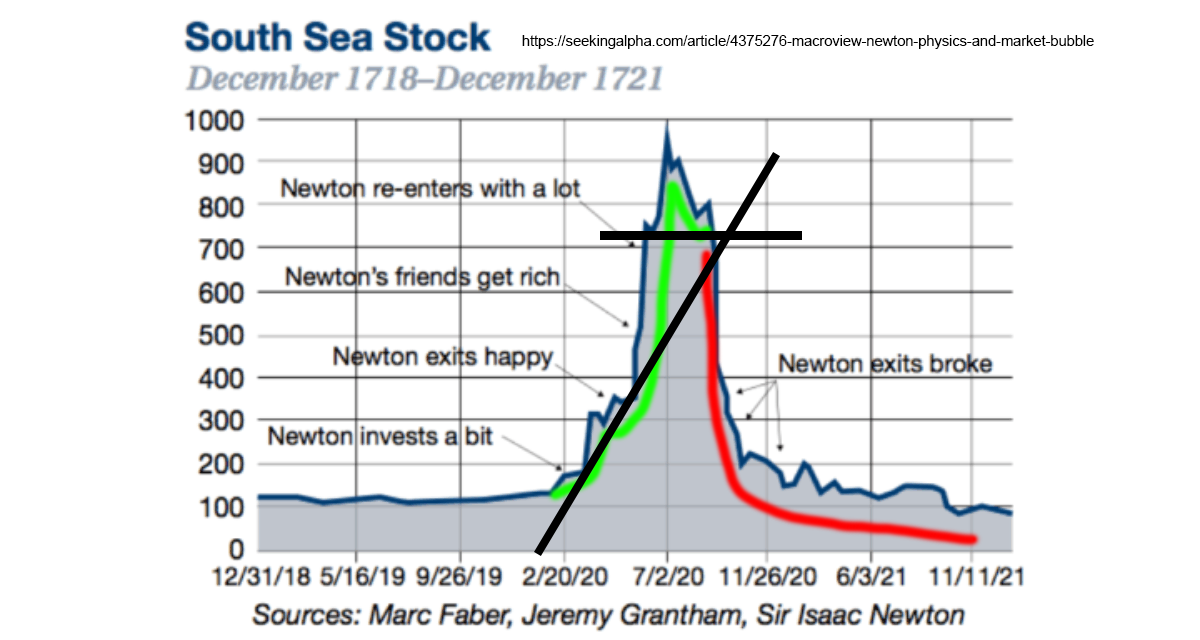
—Chart last seen in February 2024's "Nvidia Collapses (gives back half yesterday's gains) plus Isaac Newton and Daniel Defoe do a drive by (NVDA)"