IRI ENSO Forecast
2019 November Quick Look
Published: November 19, 2019
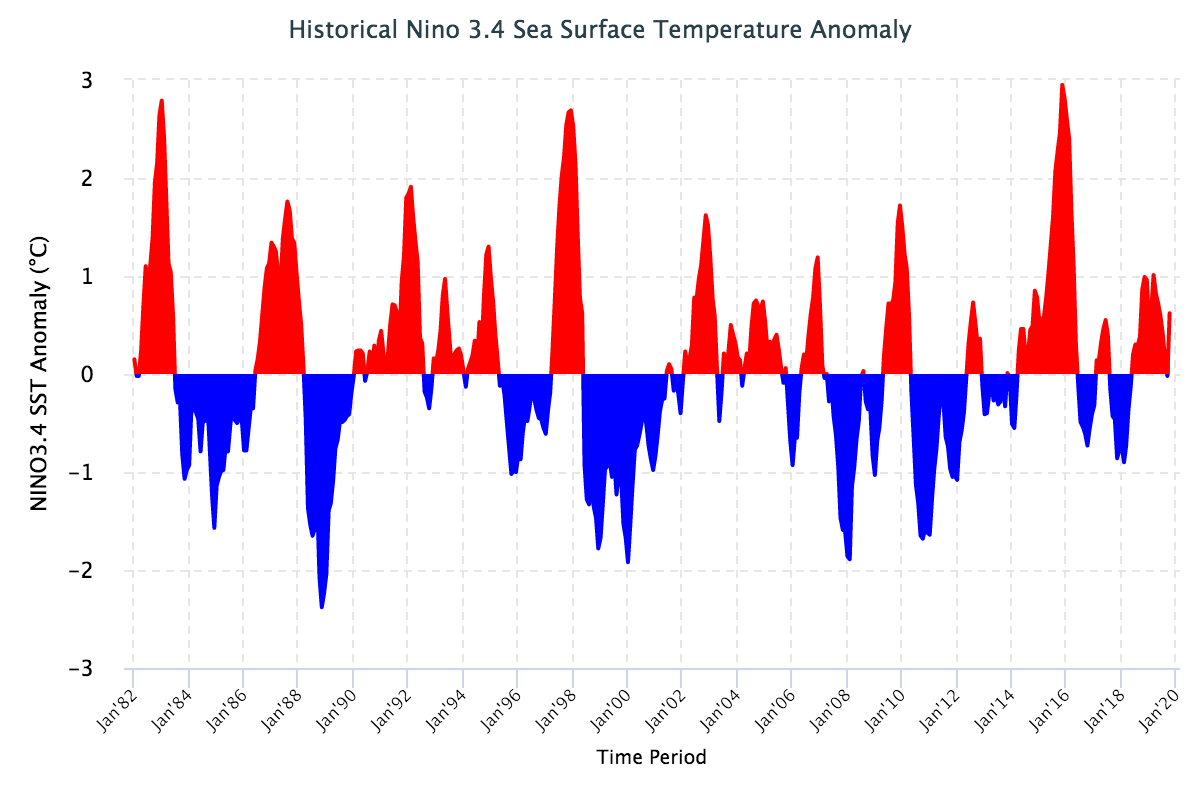
A monthly summary of the status of El Niño, La Niña, and the Southern Oscillation, or ENSO, based on the NINO3.4 index (120-170W, 5S-5N)
Use the navigation menu on the right to navigate to the different forecast sections
SSTs in the east-central Pacific were near thresholds of weak El Niño levels during October and early November. However, patterns in most atmospheric variables generally maintained neutral conditions. The oceanic warming is attributed to intraseasonal variability, and the overall diagnosis indicates ENSO-neutral conditions. Most model forecasts favor ENSO-neutral through winter and spring, with slightly higher chances for El Niño than La Niña. The official CPC/IRI outlook is consistent with these model forecasts....MORE
Click through to IRI for the model forecasts.
And from NOAA's Climate.gov:
U.S. winter temperatures for every El Niño since 1950
October 24, 2018
The tropical Pacific climate pattern known as "ENSO," which is short for El Niño-Southern Oscillation, has its strongest influence on the U.S. climate during winter (December-February). El Niño in general acts to tilt the odds toward wetter- and cooler-than-average conditions across much of the South, and toward drier and warmer conditions in many of the northern regions. El Niño's influence on temperature is less reliable than its influence on precipitation.
The collection of maps at right show the difference from average (1981-2010) winter temperature (December-February) in each U.S. climate division during all El Niño events since 1950. Years are ranked from strongest El Niño (top left) to weakest (bottom right)‚ based on the December–February Oceanic Niño Index value. There is no universal way to define the strength of El Niño events, but for this graphic, events with ONI values above 1.5 are ranked as strong, events with ONI values between 1 and 1.5 are ranked as moderate, and events with ONI values between 0.5 and 1 are ranked as weak.

These maps were first published on our ENSO blog as part of the 2015-16 winter outlook post by Mike Halpert, Deputy Director of NOAA's Climate Prediction Center. They were updated for Halpert's post about the 2018-19 winter outlook. In the original post, Halpert pointed out that compared to precipitation, temperature patterns are much less consistent, even during the strongest events....MORE
Keep in mind the ENSO is only one input into what will transpire but looking at the weak years, it is such a mixed bag (with a slight downside bias) that ENSO isn't much help.
Two wildcards:
1) The current jet stream flow is meridonal (north - south), similar to 1977:
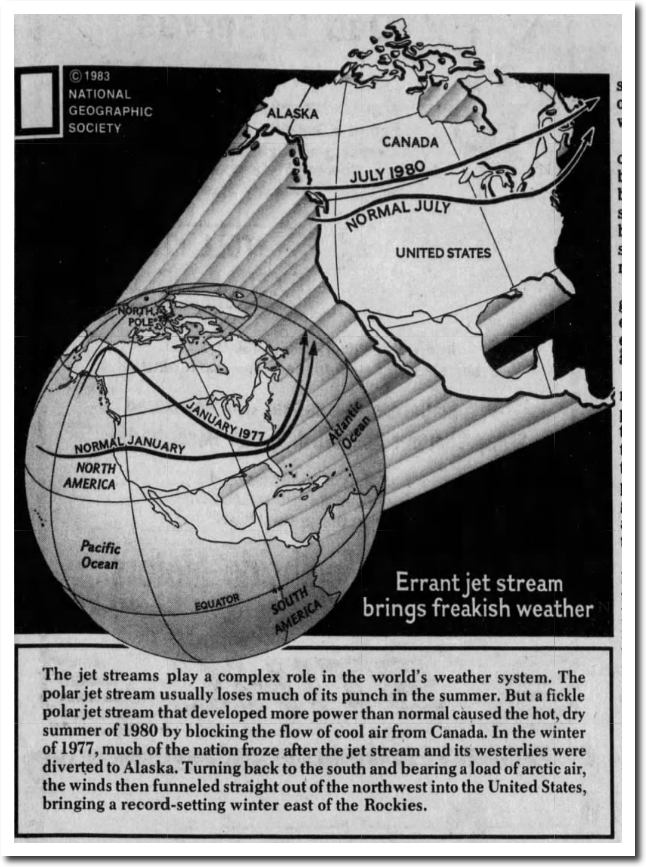
which was a very cold year in natural gas burning areas of the U.S..
2) There are signs the arctic may be setting up for a Sudden Stratospheric Warming event that would push polar air down to lower latitudes.
The question, should the SSW occur, is does the cold air go to North America or Europe/Eurasia.
Two wildcards:
1) The current jet stream flow is meridonal (north - south), similar to 1977:
which was a very cold year in natural gas burning areas of the U.S..
2) There are signs the arctic may be setting up for a Sudden Stratospheric Warming event that would push polar air down to lower latitudes.
The question, should the SSW occur, is does the cold air go to North America or Europe/Eurasia.