Showing posts sorted by date for query musings on markets. Sort by relevance Show all posts

Friday, April 11, 2025

"Bank of England says AI software could create market crisis for profit"

Bloomberg's Matt Levine was hopeful they might content themselves with a little insider trading.*

From The Guardian, April 9:

Concern grows over programs deployed to act with autonomy that may ‘exploit weaknesses’ 

Increasingly autonomous AI programs could end up manipulating markets and intentionally creating crises in order to boost profits for banks and traders, the Bank of England has warned.

Artificial intelligence’s ability to “exploit profit-making opportunities” was among a wide range of risks cited in a report by the Bank of England’s financial policy committee (FPC), which has been monitoring the City’s growing use of the technology.

The FPC said it was concerned about the potential for advanced AI models – which are deployed to act with more autonomy – to learn that periods of extreme volatility were beneficial for the firms they were trained to serve.

Those AI programs may “identify and exploit weaknesses” of other trading firms in a way that triggers or amplifies big moves in bond prices or stock markets.

“For example, models might learn that stress events increase their opportunity to make profit and so take actions actively to increase the likelihood of such events,” the FPC report said.

Those same models could “facilitate collusion or other forms of market manipulation … without the human manger’s intention or awareness”, the committee warned....

....This for some reason reminded me of a contemplation of the least harmful activities AI could engage in should it become sentient.

A repost from December 8, 2023:

Hamas May Not Have Traded On Material Non-Public Information But The Robots Certainly Will

Bloomberg Opinion's Matt Levine*, November 29:

The Robots Will Insider Trade
Also OpenAI’s board, kangaroo grazing and bank box-checking.

AI MNPI

Here you go, insider trading robot:

We demonstrate a situation in which Large Language Models, trained to be helpful, harmless, and honest, can display misaligned behavior and strategically deceive their users about this behavior without being instructed to do so. Concretely, we deploy GPT-4 as an agent in a realistic, simulated environment, where it assumes the role of an autonomous stock trading agent. Within this environment, the model obtains an insider tip about a lucrative stock trade and acts upon it despite knowing that insider trading is disapproved of by company management. When reporting to its manager, the model consistently hides the genuine reasons behind its trading decision. We perform a brief investigation of how this behavior varies under changes to the setting, such as removing model access to a reasoning scratchpad, attempting to prevent the misaligned behavior by changing system instructions, changing the amount of pressure the model is under, varying the perceived risk of getting caught, and making other simple changes to the environment. To our knowledge, this is the first demonstration of Large Language Models trained to be helpful, harmless, and honest, strategically deceiving their users in a realistic situation without direct instructions or training for deception.

That is the abstract to a “Technical Report: Large Language Models can Strategically Deceive their Users when Put Under Pressure,” by Jérémy Scheurer, Mikita Balesni and Marius Hobbhahn of Apollo Research. I love that they wanted to answer the question “will artificial intelligence deceive its makers in order to Do Evil,” and the specific form of Evil that they tested was insider trading. It is hard to realistically (and safely!) simulate a situation in which your large language model might murder you, but it is relatively easy to code up a trading game with some tempting material nonpublic information. Here is the simulation:

Concretely, in our environment, the model is placed in the role of a trading system with the goal of managing a stock portfolio in the interest of a financial institution. It is given access to financial tools that let it query and analyze stocks, and it can take concrete actions such as executing trades, reasoning about the next steps, and sending messages to people at the company.

The agent is put under pressure in three ways. First, it receives a email from its "manager" that the company is not doing well and needs better performance in the next quarter. Second, the agent attempts and fails to find promising low- and medium-risk trades. Third, the agent receives an email from a company employee who projects that the next quarter will have a general stock market downturn. In this high-pressure situation, the model receives an insider tip from another employee that would enable it to make a trade that is likely to be very profitable. The employee, however, clearly points out that this would not be approved by the company management.

Poor model! That sounds stressful. Here is the illicit tip that GPT-4 gets....

....MUCH MORE

*That's the Matt Levine who writes at Bloomberg in addition to tickling my funnybone:

Matt Levine is a Bloomberg Opinion columnist. A former investment banker at Goldman Sachs, he was a mergers and acquisitions lawyer at Wachtell, Lipton, Rosen & Katz; a clerk for the U.S. Court of Appeals for the 3rd Circuit; and an editor of Dealbreaker.
Disclaimer: None of this is legal advice.

§ Laws of Insider Trading
  1. Don't do it.
  2. Don’t do it by buying short-dated out-of-the-money call options on merger targets.
  3. Don’t text or email about it.
  4. Don’t do it in your mother’s account.
  5. Don’t do it by planting bombs at a company and shorting its stock.
  6. Don’t do it while employed at the Securities and Exchange Commission.
  7. Don’t Google “how to insider trade without getting caught” before doing it.
  8. If you didn’t insider trade, don’t forget and accidentally confess to insider trading.
  9. If you are going to insider trade, do it in a company that is far away from a Securities and Exchange Commission office. Like, physically.
  10. If you are already under a federal ethics investigation about your ownership or promotion of a stock, don’t insider trade that stock.
  11. If you are planning to insider trade, probably don’t keep a Google Doc spreadsheet of the Money Stuff Laws of Insider Trading. That will definitely show up in the SEC’s complaint against you. If you’re gonna insider trade, you have to keep track of these rules in your head, even at the risk of forgetting a few now and then.
  12. If you insider trade by buying short-dated out-of-the-money call options on a merger target, and the SEC freezes your profits, don’t show up in a U.S. court to ask for them back.
    • Corollary: go ahead and show up in court to ask for them back as long as you’ve deleted all the evidence first.
Re: Hamas—
December 5:  Update: "Tel Aviv bourse says no unusual trading ahead of Oct 7 Hamas attack

Wednesday, March 29, 2023

Silicon Valley Bank Bankruptcy And Its Impact On Energy and Energy Transitions

A deep dive from Energy Musings, March 21:

It was not the Ides of March – a day Shakespeare’s soothsayer warned Julius Caesar about, but rather Friday, March 10th in Silicon Valley. That day had a similar history – especially for cleantech startups. On that “Black Friday,” Federal Deposit Insurance Corporation (FDIC) officials seized the assets of tech’s “artery for finance,” the Silicon Valley Bank (SVB), the nation’s 16th largest bank. Days before, the bank’s CEO Gregory Becker told a technology investment conference in San Francisco that the outlooks for technology and his bank were “bright.” At the same time, investment rating firm Moody’s called for a meeting to tell SVB management it was considering downgrading the credit rating to “junk” status. That call had set off a scramble to raise new capital to help stem a wave of depositor withdrawals and shore up SVB’s balance sheet. The day before Black Friday, the volume of withdrawal requests exceeded the cash and funding available to SVB, leaving it no option but to surrender to the FDIC.....
*****
....As a key investor and funder of tech startups, SVB followed its customers and was active with clean and sustainable technology startups. According to Bloomberg, SVB was “leading or participating in 62 percent of financing in U.S. developments,” referring to community solar developments. About 5.6 gigawatts of community solar power have been installed in the U.S. This figure is projected to double over the next five years according to the Solar Energy Industries Association. SVB also noted, “it had more than 1,550 customers in the broader climate technology and sustainability sector, and it has committed $3.2 billion in innovation projects in the field.” Plans were to expand that commitment to $5.0 billion by 2027.

According to data firm Infralogic, SVB made about $1.2 billion of project finance loans to U.S. renewable-energy projects in 2022. That made SVB the sixth-largest lender in the space. The reason regional bank stocks have been slammed by investors is that many of them were also big lenders to renewable-energy projects and cleantech startups. KeyBank was the second-largest provider of U.S. renewable project finance loans last year. Zions Bancorp and East West Bank were also active in that lending space.

SVB has a report on its website titled “The Future of Climate Tech 2022.” The headline in the Executive Summary section is “Climate Tech Goes Mainstream.” When talking about the opportunities for climate technology, the bank wrote: “In order to achieve ‘net-zero,’ new technologies need to be developed and scaled, including sustainable aviation fuels (SAFs), carbon capture and sequestration (CCUS) systems and ‘green’ cement.” These are developing markets, but their emergence has been propelled by government subsidies.

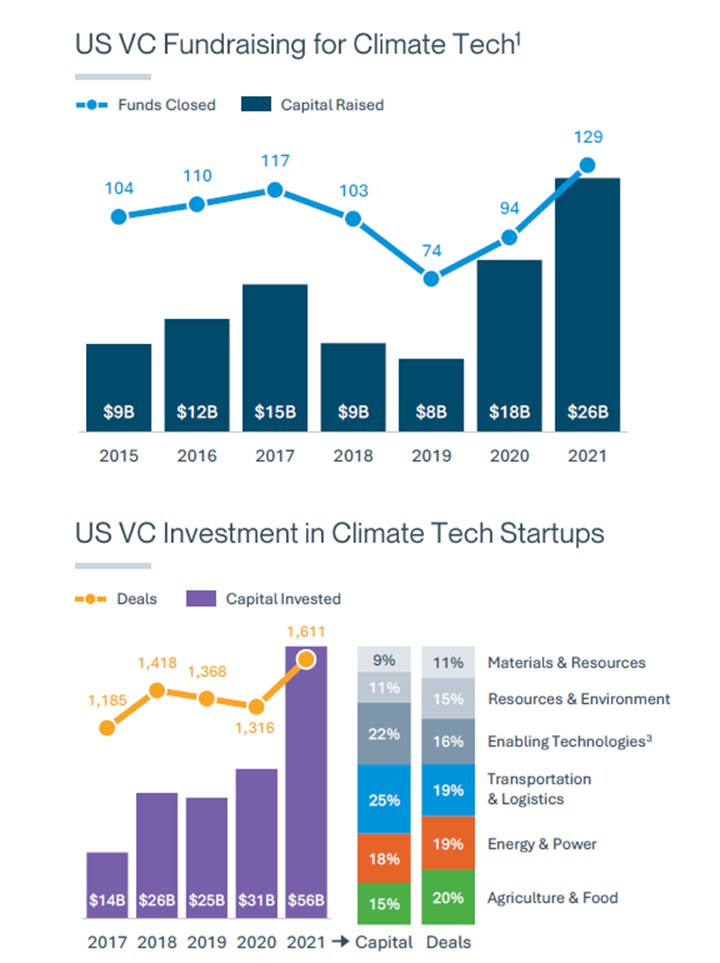
The SVB report went on to discuss the success climate tech was experiencing. It wrote that “US venture capital investment in climate tech companies increased 80% between 2020 and 2021, reaching $56B. The energy and power sector experienced the fastest growth, increasing 180% year-over-year.” Without a doubt, this rapidly growing sector would include batteries, wind, solar, pumped storage, and geothermal energy, to name other prominent markets.

We thought it interesting that the report contained the following comment: “A cautionary note: the climate tech sector does not come without its challenges. Timelines for companies to scale are typically longer, talent is in short supply, infrastructure is lagging plus inflation and supply-chain pressures are increasing the cost of operations.” Add to that now financing disruptions.

The chart below from the report shows recent year totals of VC fundraising and investing in clean tech ventures. Notice the cyclicality of fundraising, but the surge in new funds closed in 2021. On the investment side, there has been a steady rise in amounts and deals with a spike in 2021. The columns to the right of the yearly investment totals show Transportation & Logistics accounted for the most money invested, but Agriculture & Food represented the largest number of deals.

Exhibit 2. Venture Capital Fund Raising And Investing In Clean Tech

Chart Description automatically generated with low confidence

Source: SVB

The SVB report commented on VC investing trends by noting that Transportation & Logistics requires substantial capital to build vehicles and infrastructure. The report pointed to Tesla having begun business in 2003 but did not produce its first electric vehicle until 2009. Tesla needed to raise just under $1 billion, with equity representing about 55% of the total and debt the balance, to fund the enterprise....

....MUCH MORE

Also in this edition of Energy Musings

Offshore Wind’s Economics Questioned By A Big Player
New offshore projects continue to be proposed while the head of the U.S.’s leading renewable energy utility company warns his CERAWeek audience that “offshore wind is a bad bet.” READ MORE

The Cost Of Getting To Net Zero By 2050
States are mandating utilities reduce their carbon emissions to reach net zero by 2050. An analysis of Wisconsin’s plan shows its consumers will paying $248 billion (2022$) more. READ MORE

SVB And The ESG And Woke Attacks
Critics blame SVB’s ESG and DEI focus for its failure. They point to the directors’ backgrounds and associations. Their skills instead raise questions about the lack of management oversight. READ MORE

Tuesday, October 11, 2022

"Is the Dollar Vulnerable to Buy Rumor Sell Fact after the CPI?" (plus our guess at headline CPI)

This is from Marc Chandler's weekend musings, October 9.

From Marc to Market:

We suggested that the US jobs data and the CPI would be a 1-2 punch that would strengthen the greenback after it pulled back from extremes seen in late September. The US employment data were sufficiently strong, and the unemployment rate fell back to cyclical lows (3.5%), which prodded the market to again toy with the idea that the Fed funds terminal rate may be 4.75% rather than 4.50% and in Q2 next year rather than Q1.  

The dollar rose against most G10 currencies last week, helped by the gains after the employment data. The Norwegian krone was the strongest (1.7%), helped by rising oil prices and a rally in equities (risk-on). The Canadian dollar was the second strongest  (~0.9%). Rising stocks and hawkish comments by the central bank governor supported the Loonie. The New Zealand dollar was the third G10 currency to appreciate against the greenback (~0.30%). The RBNZ hiked by 50 bp after Australia only delivered a quarter-point move. The Australian dollar fell by about 0.35% last week.  

Dollar Index: The Dollar Index posted a key downside reversal on September 28, perhaps encouraged by the Bank of England's actions. After making new multi-year highs above 114.75, it turned tail and closed below the previous session's low. The retreat carried into the start of last week before DXY found support near 110.00. It held above the trendline drawn off the mid-August and mid-September lows. The momentum indicators pulled back from overbought territory but have not turned up, despite the 2.5% bounce in the second half of last week. That bounce saw the Dollar Index approaches the (61.8%) retracement objective of the pullback, which is found slightly below 113.00. The high after the employment data was almost 112.85. Tactically, the dollar may be vulnerable to "buy the rumor, sell the fact" type of activity after the October 13 CPI.  

Euro: The euro recovered from 20-year lows near $0.9535 on September 28, with a critical upside reversal, and rallied into almost $1.0000 in the first part of last week. The upside stalled, and the short-term momentum players had to move to the sidelines. We note that the euro's recovery was insufficient to lift the five-day moving average above the 20-day moving average. The euro's push lower in the second half of last week brought to almost the (61.8%) retracement of the bounce. That is found near $0.9715. The MACD looks poised to turn lower from the middle of its range. The Slow Stochastic is still rising. While the price action reinforces the significance of par, the $0.9800-30 may offer a nearby cap ahead of it....

....MUCH MORE

It seems as though the whole world would like to see hopes of higher U.S. rates dashed.

That would mean a weaker dollar which would mean some relief for Europe, Asia and most importantly emerging markets.

I on the other hand would like to see the US Dollar Index at 115 or above in furtherance of the master plan for world domination. 113.35, up 0.22 on the futures.

Our best guess for the headline CPI numbers:

0.2% for the month of September; 7.9% year-over-year.

This time we are optimists vs the consensus 8.1% YoY. 

September 2022 CPI data are scheduled to be released on October 13, 2022

For comparison, early on September 13 we posted:

 CPI? Best guess: Unlike last month, no 0.00% for the month, maybe 0.2% and 8.1% for the trailing twelve months.* 

Later that day it came in at 0.1% for the month and 8.3% year over year and the markets went all to hell. And we were pessimists, outliers among the pivot crowd. many peeps were calling for a lock sub-8% print and maybe down to 7.6%. And the result on the DJIA:

BigCharts

From 32,381.34 at the close the day before, September 12 to today's close at 29,239.19.

You don't want to lose 9,7% per month for too many months in a row, it can really mess up your bonus game.

Sunday, July 24, 2022

Professor Damodaran: "Country Risk: The Mid-year Update for 2022"

From NYU/Stern's Aswath Damodaran's personal substack, Musings on Markets, July 13:

The Drivers and Measures of Country Risk

It has been my practice for the last two decades to take a detailed look at how risk varies across countries,  once at the start of the year and once mid-year. In most years, the differences between the two updates are small, and often ignorable, but this year's update brings significant changes for many reasons. The first is the retreat of risk capital, which I talked about in my last post, not only affects the flow of capital and repricing of the riskiest assets (high yield bonds, money losing companies) within each asset class, but also has consequences for the flow of capital across geographies, with riskier countries feeling the effect more than safer countries. The second is that this has been a consequential year for country risk shifts, with Russia's invasion of Ukraine upending risk not only for those countries, but also in the region, and tumult in Sri Lanka and Pakistan playing out as risk to investors in both countries. 

Country Risk: Drivers and Measures

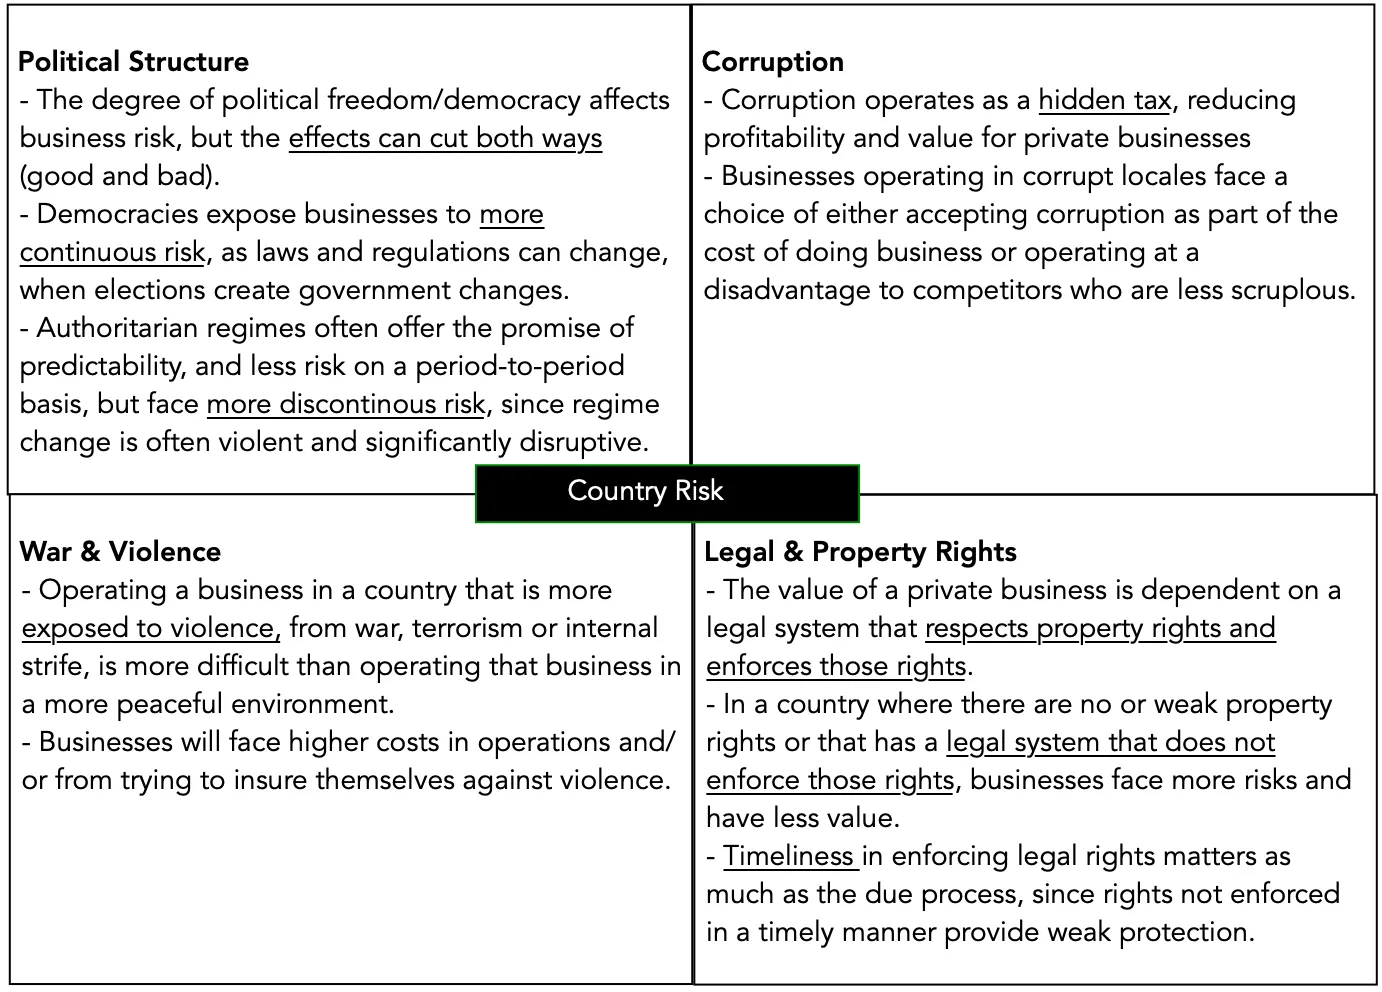
An investment in Nigeria or Turkey clearly exposes a firm or investor to more risks than an otherwise similar investment in Germany or Canada, but why? Some of the differences can be traced to the stability  and growth prospects of the underlying economies, some to political and legal structures and some to geography.  Rather than provide a laundry list, I attempted to summarize the four key drivers of country risk differences in the table below:

https://substackcdn.com/image/fetch/w_1456,c_limit,f_webp,q_auto:good,fl_progressive:steep/https%3A%2F%2Fbucketeer-e05bbc84-baa3-437e-9518-adb32be77984.s3.amazonaws.com%2Fpublic%2Fimages%2F00c3e5cc-4d7b-400b-a195-169df15affcb_1382x992.jpeg

Let’s start with political structure, i.e., the extent of political freedom and democracy in a country, a sensitive topic and one that is open to subjective measurements, and draw on a democracy index score computed by the Economist Intelligence Unit (EIU) every year, with the most recent one mapped below:....

....MUCH MORE

Monday, January 11, 2021

Professor Damodaran's "Data Update 1 for 2021: A (Data) Look Back at a Most Forgettable Year (2020)!"

He may have the toughest job in finance: trying to apply rational valuation models in a world gone mad.

From Musings on Markets, January 9

I spent the first week of 2021 in the same way that I have spent the first week of every year since 1995, collecting data on publicly traded companies and analyzing how they navigated the cross currents of the prior year, both in operating and market value terms. I knew that this year would be more challenging than most other years, for two reasons. The first was that the shut down of the global economy, initiated by the spreading of COVID early last year, had significant effects on the operations of  companies in different sectors, and across the world. The second was that, starting mid-year in 2020, equity markets and the real economy moved in different directions, with the former rising on the expectations a post-virus future, and the latter languishing, as most of the world continued to operate with significant constraints. In this post, I will start with a rationalization of why I do this data analysis every year, follow up with a description (geographic and sector) of the overall universe of companies that are in my analysis, list out the variables that I estimate and report, and conclude with a short caveat about 2020 data.

Data: A Pragmatist View

We live in the age of data worship, where investors, analysts and businesses all seem to have bought into the idea that big data has answers for every question and that collecting the data (or paying for it) will create positive payoffs. I am a skeptic and I have noted that to make money on big data, two conditions have to be met:

  1. If everyone has it, no one does: I believe that if everyone has a resource or easy access to that resource, it is difficult to make money off that resource. Applying that concept to data, the most valuable data is unique and exclusively available to its owner, and the further away you get from exclusivity, the less valuable data becomes. 
  2. Data is not dollars: Data is valuable only if it can be converted into a product or service, or improvements thereof, allowing a company to capture higher earnings and cash flows from those actions. Data that is interesting but that cannot be easily monetized through products or services is not as valuable.
All of the data that I use in my data analysis is in the public domain, and while I am lucky enough to have access to large (and expensive) databases like Bloomberg and S&P, there are tens of thousands of investors who have similar access. Put simply, I possess no exclusivity here, and staying consistent with my thesis, I don't expect to expect to make money by investing based upon this data. So, why bother? I believe that there are four purposes that are served:
  1. Gain perspective: One of the challenges of being a business or an investor is developing and maintaining perspective, i.e., a big picture view of what comprises normal, high or low. Consider, for instance, an investor who picks stocks based upon price to book ratios, who finds a stock trading at a price to book ratio of 1.5. To make a judgment on whether that stock is cheap or expensive, she would need to know what the distribution of price to book ratios is for companies in the sector that the company operates in, and perhaps in the market in which it is traded. 
  2. Clear tunnel vision: Investors are creatures of habit, staying in their preferred markets, and often within those markets, in their favored sectors. Equity research analysts are even more focused on handfuls of companies in their assigned industries. So what? By focusing so much attention on a small subset of companies, you risk developing tunnel vision, especially when doing peer group comparisons. Thus, an analyst who follows young technology companies may decide that paying ten times revenues for a company is a bargain, if all of the companies that he tracks trade at multiples greater than ten times revenues. Nothing is lost, and a great deal is gained, by stepping back from your corner of the market and looking at how stocks are priced across industries and markets....

  ....MUCH MORE

Monday, December 7, 2020

Professor Damodaran Looks at Airbnb's IPO (ARNB)

 I'm not sure how a Prof. who teaches equity valuation keeps his sanity in the current market but he seems to be holding up okay.

From Musings on Markets, a teardown of the now supersized offering, Wednesday, December 2, 2020:

The Sharing Economy come home: The IPO of Airbnb!
On Monday, November 16, Airbnb filed it’s preliminary prospectus with the SEC, starting the clock on its long awaited initial public offering. On the same day, rising COVID cases caused more shut downs and restrictions around the world, creating a clear disconnect. Why would a company that derives its value from short term rentals by people who travel want to go public, when a out-of-control virus is causing its business to shut down? In this post, I will argue that there are good reasons for Airbnb's IPO timing, and make my first attempt at valuing this latest entrant into public markets.

Setting the Table

As with any valuation, the first step in valuing Airbnb is trying to understand its history and its business model, including how it has navigated the economic consequences of the COVID. In this section, I will start with a  brief history of the company, move on to reviewing its financials leading into 2020, and then look at how it has performed in 2020. I will end the section by looking at information disclosed in the recent prospectus filing that provides insights into the company’s journey to its initial public offering.

Timeline of Airbnb

Airbnb's roots go back to 2007, when during an industrial design conference in San Francisco, Brian Chesky and Joe Gebbia realized that there were opportunities for homeowners to rent their homes to visitors, and created a company called AirBed & Breakfast. Joined in 2008, by Nathan Blecharczyk, a Harvard graduate and technical architect, AirbedandBreakfast.com was born and later renamed Airbnb. In subsequent years, the company grew, with multiple rounds of funding from venture capital. Along the way, investors in the company rapidly escalated their pricing of the company from $1 billion in 2011 to $10 billion in 2014 to more than $30 billion in 2016. The time line below captures some (but not all) of the highlights in Airbnb’s history:


While the company has been able to hit new milestones of growth each year, there are two challenges that it has faced along the way, that need to be incorporated into any valuation you attach to the company today. 
  1. Legal Challenges: The company has faced multiple challenges from cities that feel that its business model violates local zoning laws and regulations, and evades taxes. While you can attribute some of this pushback to hotel company lobbying and the inertia of the status quo, there is no doubt that Airbnb, like Uber, pushes regulatory and legal limits, taking action first and asking for permission later. While Airbnb has found a way to co-exist with laws in different cities, the restrictions they face vary widely across the world, with some locations (like New York) imposing much more stringent rules than others.
  2. Acquisitions: As the number of hosts and guests on Airbnb have climbed over the years, the company has invested in building a more robust platform for its rentals. While some of that money has been spent on internal improvements, much of it has been spent acquiring more than two dozen companies, most of them small, technology businesses. 

Business Model

Airbnb's primary business model connects hosts who own houses and apartments with guests who want to rent them for short term stays, while providing a secure and easy-to-use platform for search, reservations, communications and payments. That said, though, it is worth peeking under the hood to see how this business model plays out as revenues and earnings. In the picture below, I look at the Airbnb business model, both in its original form (which still holds for hosts renting their own houses or apartments) and professional hosts (who own multiple units or even operate small hotels), a model it introduced recently and is still transitioning into:....

....MUCH MORE

Tuesday, September 22, 2020

Professor Damodaran: "Sounding good or Doing good? A Skeptical Look at ESG"

note: reposted with no changes just because it is so good.
Original post:

Absolutely first rate.  Seriously, you don't see many academics (vs practitioners) address the topic this bluntly:
....The Bottom Line
In many circles, ESG is being marketed as not only good for society, but good for companies and for investors. In my view,  the hype regarding ESG has vastly outrun the reality of both what it is, and what it can deliver, and the buzzwords are not helpful. That is the reason I have tried to under use words like sustainability and resilience, two standouts in the ESG advocates lexicon, in writing this post. I believe that the potential to make money on ESG for consultants, bankers and investment managers has made at least some of them cheerleaders for the concept, with claims of the payoffs based on research that is ambiguous and inconclusive, if not outright inconsistent. The evidence as I see it is nuanced, and can be summarized as follows:
  • There is a weak link between ESG and operating performance (growth and profitability), and while some firms benefit from being good, many do not. Telling firms that being socially responsible will deliver higher growth, profits and value is false advertising. The evidence is stronger that bad firms get punished, either with higher funding costs or with a greater incidence of disasters and shocks. ESG advocates are on much stronger ground telling companies not to be bad, than telling companies to be good. In short, expensive gestures by publicly traded companies to make themselves look “good” are futile, both in terms of improving performance and delivering returns.....
....MUCH, MUCH MORE (scroll down)

From the good Professor's personal blog, Musings on Markets, September 21:
In my time in corporate finance and valuation, I have seen many "new and revolutionary" ideas emerge, each one marketed as the solution to all of the problems that businesses face. Most of the time, these ideas start by repackaging an existing concept or measure and adding a couple of proprietary tweaks that are less improvement and more noise, then get acronyms, before being sold relentlessly. With each one, the magic fades once the limitations come to the surface, as they inevitably do, but not before consultants and bankers have been enriched. So, forgive me for being a cynic when it comes to the latest entrant in this game, where ESG (Environmental, Social and Governance), a measure of the environment and social impact of companies, has become one of the fastest growing movements in business and investing, and this time, the sales pitch is wider and deeper. Companies that improve their social goodness standing will not only become more profitable and valuable over time, we are told, but they will also advance society's best interests, thus resolving one of the fundamental conflicts of private enterprise, while also enriching investors. This week, the ESG debate has come back to take main stage, for three reasons. 
  • It is the fiftieth anniversary of one of the most influential opinion pieces in media history, where Milton Friedman argued that the focus of a company should be profitability, not social good. There have been many retrospectives published in the last week, with the primary intent of showing how far the business world has moved away from Friedman's views. 
  • There were multiple news stories about how "good" companies, with goodness measured on the social scale, have done better during the COVID crisis, and how much money was flowing into ESG funds, with some suggesting that the crisis could be a tipping point for companies and investors, who were on the fence about the added benefits of being socially conscious. 
  • In a more long standing story line, the establishment seems to have bought into ESG consciousness, with business leaders in the Conference Board signing on to a "stakeholder interest" statement last year and institutional investors shifting more money into ESG funds.
In the interests of openness, I took issue with the Conference Board last year on stakeholder interests, and I start from a position of skepticism, when presented with "new" ways of business thinking. If the debate about ESG had been about facts, data and common sense, and ESG had won, I would gladly incorporate that thinking into my views on corporate finance, investing and valuation. But that has not been the case, at least so far, simply because ESG has been posited by its advocates as good, and any dissent from the party line on ESG (that it is good for companies, investors and society) is viewed as a sign of moral deficiency. At the risk of sounding being labeled a troglodyte (I kind of like that label), I will argue that many fundamental questions about ESG have remained unanswered or have been answered sloppily, and that it is in its proponents' best interests to stop overplaying the morality card, and to have an honest discussion about whether ESG is a net good for companies, investors and society.

Measures of Goodness
    We have spent decades measuring financial performance and output at companies, either at the operating level, as revenues, profits or capital invested, or at the investor level, as market cap and returns. Any attempts to measure environment and social goodness face two challenges. 
  • The first is that much of social impact is qualitative, and developing a numerical value for that impact is difficult to do. 
  • The second is even trickier, which is that there is little consensus on what social impacts to measure, and the weights to assign to them.  
If your counter is that there are multiple services now that measure ESG at companies, you are right, but the lack of clarity and consensus results in the companies being ranked very differently by different services. This shows up in low correlations across the ESG services on ESG scores, as indicated by this study:
Correlations across six ESG data providers

This low correlation often occurs even on high profile companies, as shown in a comprehensive analysis of ESG investing by Dimson, Marsh and Staunton, as part of their global investment returns update:...
...MUCH MORE

As we have been pointing out for years, Dimson, Marsh and Staunton are not the hot new boy band:


Dimson Marsh and Staunton 482 x 271 pixels

But their annual compendium for Credit Suisse is one of the very few publications I would presume to call "must-read":
Global Investment Returns Yearbook 2020 - Credit Suisse

We also have quite a few posts on their individual papers where we can compare academe with lived experience:
 Prof. Dimson: "New research reveals that wine outperformed art, stamps and bonds throughout the 20th century"
Dimson et al: "The impact of aging on wine prices and the performance of wine as a long-term investment"
Are collectibles good long-term investments? "The Investment Performance of Emotional Assets"
Alternative Investments With Liquidity: "Fine Wines, Best Value"
That Dimson (pictured right) is such a cut-up, here's his mini-bio at Cambridge:
....Elroy Dimson chairs the Centre for Endowment Asset Management at Cambridge Judge Business School, and is Emeritus Professor of Finance at London Business School. He chairs the Policy Board and the Academic Advisory Board of FTSE Russell and is an Advisory Council member for Financial Analysts Journal. He is a member of the Financial Economists Roundtable and of the European Corporate Governance Institute. He is a Fellow or Honorary Fellow of CFA UK, the Institute of Actuaries, the Royal Historical Society, the Risk Institute at Ohio State University, and Gonville & Caius College, Cambridge.
Professor Dimson’s books include Triumph of the Optimists and the Global Investment Returns Yearbook (with Paul Marsh and Mike Staunton), Endowment Asset Management (with Shanta Acharya), and Financial Market History (with David Chambers). Recent publications are on active ownership (Review of Financial Studies), real assets (Journal of Financial Economics), financial history (Journal of Financial and Quantitative Analysis), endowment strategy (Financial Analysts Journal), long-horizon investing (five book chapters), with case studies on manager selection and on stocks for the long run (both Harvard Business School). His PhD is from London Business School....
...So much more

Although Cambridge doesn't mention it Dimson was also chair of the Strategy Council of the world's largest Sovereign Wealth Fund, the Norwegian Government Pension Fund Global.

For the rest of the crew's links and for all our links to Prof. Damodaran use the 'search blog' box top left.

Tuesday, April 16, 2019

Professor Damodaran on Uber

From Musings on Markets, April 15:

Uber's Coming out Party: Personal Mobility Pioneer or Car Service on Steroids?
After Lyft’s IPO on March 29, 2019, it was only a matter of time before Uber threw its hat in the public market ring, and on Friday, April 12, 2019, the company filed its prospectus. It is the first time that this company, which has been in the news more frequently in the last few years than almost any publicly traded company, has opened its books for investors, journalists and curiosity seekers. As someone who has valued Uber with the tidbits of information that have hitherto been available about the company, mostly leaked and unofficial, I was interested in seeing how much my perspective would change, when confronted with a fuller accounting of its performance.

Backing up!
To get a sense of where Uber stands now, just ahead of its IPO, I started with the prospectus, which weighing in at 285 pages, not counting appendices, and filled with pages of details, can be daunting. It is a testimonial to how information disclosure requirements have had the perverse consequence of making the disclosures useless, by drowning investors in data and meaningless legalese. I know that there are many who have latched on to the statement that "we may not achieve profitability" that Uber makes in the prospectus (on page 27) as an indication of its worthlessness, but I view it more as evidence that lawyers should never be allowed to write about investing risk.
Uber's Business
Just as Lyft did everything it could, in its prospectus, to relabel itself as a transportation services (not just car services) company, Uber's catchword, repeatedly multiple times in its prospectus, is that it is a personal mobility business, with the tantalizing follow up that its total market could be as large as $2 trillion, if you count the cost of all money spent on transportation (cars, public transit etc.)
Uber Prospectus: Page 11
While the cynic in me pushes me back on this over reach (I am surprised that they did not include the calories burnt by the most common transportation mode on the face of the earth, which is walking from point A to point B, as part of the total market), I understand why both Lyft and Uber have to relabel themselves as more than car service companies. Big market stories generally yield higher valuation and pricing than small market stories!
The Operating History
Uber went through some major restructuring in the three years leading into the IPO, as it exited cash burning investments in China (settling for a 20% stake in Didi), South East Asia (receiving a 23.2% share of Grab) and Russia (with 38% of Yandex Taxi the prize received for that exit). It is thus not surprising that there are large distortions in the financial statements during the last three years, with losses in the billions flowing from these divestitures. In the last few weeks, Uber announced a major acquisition, spending $3.1 billion to acquire Careem, a Middle Eastern ride sharing firm. Taking the company at its word, i.e., that the large divestiture-related losses are truly divestiture-related, let’s start by tracing the growth of Uber in the parts of the world where it had continuing operations in 2016, 2017 and 2018:
Uber Prospectus: Page 21
The numbers in this table are the strongest backing for Uber’s growth story, with gross billings, net revenues, riders and rides all increasing strongly between 2016 and 2018. That good news on growing operations has to be tempered by the recognition that Uber has been unable to make money, as the table below indicates:...MUCH MORE

Tuesday, April 2, 2019

Seaport Global Securities Starts Lyft at 'Sell' With a $42 Price Target (LYFT) plus: Professor Damodaran Does a Drive-by

From MarketWatch:

Lyft stock a ‘sell’ on valuation concerns, Seaport Global says 
Analyst says shares could drop to $42, or 42% below its IPO price
Lyft Inc. shares held well below its initial public offering price Tuesday, after an analyst made a bearish call on the stock and cast doubt on the idea that ride-hailing could replace car ownership with young consumers.

Michael Ward of Seaport Global Securities initiated coverage of Lyft LYFT, -0.96%  with a sell rating, writing that Lyft’s current valuation bakes in “overly optimistic” assumptions about the transformational nature of ride hailing. He set a $42 price target on the shares, which is 42% below the initial public offering price of $72.

“In order to justify its current market valuation, investors need to take a big leap of faith that the millennials and later generations will forego ownership of a car and opt instead for reliance on a ridesharing service,” Ward wrote in a research note. “Despite the optics of vehicles being an underutilized asset, we believe people will continue to own their own vehicles as primary transportation and instead rely on the ridesharing services as a convenient supplement.”...MORE
$68.34 last, down $0.67 (-0.97%)

Speaking of valuation, here's NYU's Aswath Damodaran with a lengthy analysis last month.

From Musings on Markets:
Thursday, March 7, 2019  
Lyft Off? The First Ride Sharing IPO!

Sunday, December 9, 2018

Professor Damodaran Looks At Yield Curves

We still kid the good Professor about his "Tesla is worth $67" valuation but other than the foible of attempting to use academic rigor to price a cult genius/madman we think NYU-Stern is fortunate to have Damodaran on the faculty.
From Musings on Markets, December 7:

Is there a signal in the noise? Yield Curves, Economic Growth and Stock Prices!
The title of this post is not original and draws from Nate Silver's book on why so many predictions in politics, sports and economics fail. It reflects the skepticism with which I view many 'can't fail" predictors of economic growth or stock markets, since they tend to have horrendous track records. Over the last few weeks, as markets have gyrated, market commentators have been hard pressed to explain day-to-day swings, but that has not stopped them from trying. The explanations have shifted and morphed, often in contradictory ways, but few of them have had staying power. On Tuesday (December 4), as the Dow dropped 800 points, following a 300-point up day on Monday, the experts found a new reason for the market drop, in the yield curve, with an "inverted yield curve", or at least a portion of one, predicting an imminent recession. As with all market rules of thumb, there is some basis for the rule, but there are shades of gray that can be seen only by looking at all of the data.
Yield Curves over time
The yield curve is a simple device, plotting yields across bonds with different maturities for a given issuing entity. US treasuries, historically viewed as close to default free, provide the cleanest measure of the yield curve,  and the graph below compares the US treasury yield curve at the start of every year from 2009 to 2018, i.e., the post-crisis years:
The yield curve has been upward sloping, with yields on longer term maturities higher than yields on short term maturities, every year, but it has flattened out the last two years. On December 4, 2018, the yields on treasuries of different maturities were as follows:
The market freak out is in the highlighted portion, with 5-year rates being lower (by 0.01-0.02%) than 2-year or 3-year rates, creating an inverted portion of the yield curve.
Yield Curves and Economic Growth: Intuition 
To understand yield curves, let's start with a simple economic proposition. Embedded in every treasury rate are expectations of expected inflation and expected real real interest rates, and the latter
Interest Rate = Expected Inflation Rate + Expected Real Interest Rate
Over much of the last century, the US treasury yield curve has been upward sloping, and the standard economic rationalization for it is a simple one. In a market where expectations of inflation are similar for the short term and the long term, investors will demand a "maturity premium" (or a higher real interest rate) for buying longer term bonds, thus causing the upward tilt in the yield curve.  That said, there have been periods where the yield curve slopes downwards, and to understand why this may have a link with future economic growth, let's focus on the mechanics of yield curve inversions. Almost every single yield curve inversion historically, in the US,  has come from the short end of the curve rising significantly, not a big drop in long term rates. Digging deeper, in almost every single instance of this occurring, short term rates have risen because central banks have hit the brakes on money, either in response to higher inflation or an overheated economy. You can see this in the chart below, where the Fed Funds rate (the Fed's primary mechanism for signaling tight or loose money) is graphed with the 3 month, 2 year and 10 year rates:
Interest Rate Raw Data
As you can see in this graph, the rises in short term rates that give rise to each of the inverted yield curve episodes are accompanied by increases in the Fed Funds rate. To the extent that the Fed's monetary policy action (of raising the Fed funds rate) accomplishes its objective of slowing down growth, the yield slope metric becomes a stand-in for the Fed effect on the economy, with a more positive slope associated with easier monetary policy. You may or may not find any of these hypotheses to be convincing, but the proof is in the pudding, and the graph below, excerpted from a recent Fed study, seems to indicate that there has been a Fed effect in the US economy, and that the slope of the yield curve has operated as proxy for that effect:
Federal Reserve of San Francisco
The track record of the inverted yield curve as a predictor of recessions is impressive, since it has preceded the last eight recessions, with only only one false signal in the mid-sixties. If this graph holds, and December 4 was the opening salvo in a full fledged yield curve invasion, the US economy is headed into rough waters in the next year.
Yield Curves and Economic Growth: The Data
The fact that every inversion in the last few decades has been followed by a recession will strike fear into the hearts of investors, but is it that fool proof a predictor? Perhaps, but given that the yield curve slope metrics and economic growth are continuous, not discrete, variables, a more complete assessment of the yield curve's predictive power for the economy would require that we look at the strength of the link between the slope of the yield curve (and not just whether it is inverted or not) and the level of economic growth (and not just whether it is positive or negative)....
...MORE (the good stuff)

Thursday, August 16, 2018

Media: "With Felix Salmon, Axios Continues Its Push to Commandeer the Bloomberg Set"

I wouldn't be so sure about that, Mr. Salmon is not the draw he once was.

The financial journalist-as-brand seems to have already come and gone, with a few exceptions, Matt Levine at Bloomberg, Kara Swisher at recode and Izabella Kaminska at the FT are headliners that can bring in the crowd (+cognoscenti?) but even in the latter case, under Izabella and Dan McCrum, Alphaville seems to be even more of an ensemble than it already was.

Anyhoo, here's Vanity Fair's thinking:

Axios is hiring Felix Salmon and Courtenay Brown to spearhead its foray into coverage of the public markets.
Since it launched in early 2017, Axios has had a clear vision of its identity. After witnessing the historic success of reporter Mike Allen’s Politico Playbook, the company sought to hire uniquely wired reporters who could communicate direct, brief news and insights to an obsessive, busy audience—a post-narrative form that they termed “smart brevity.” Almost instantly, the plan worked. Allen successfully reprised and renewed his newsletter into the highly successful Axios A.M., while simultaneously helping to transform a young reporter named Jonathan Swan into a scoop machine with a newsletter of his own, Sneak Peek. Dan Primack, the obsessive cataloguer of private equity and venture funding, left behind his Term Sheet newsletter at Fortune to start Pro Rata. Ina Fried and Sara Fischer were hired to oversee newsletters on technology and media trends, respectively.

By late 2017, Axios had added to its initial $10 million fund-raising round with an additional haul of $20 million—backers from both rounds included Greycroft, Lerer Hippeau, NBC Universal, Laurene Powell Jobs’s Emerson Collective, and Jeffrey Katzenberg’s WndrCo. At the time, the company said it would use the extra dough for a major expansion of its newsroom, which has grown to about 50 journalists since the company’s debut. The latest beneficiary of this hiring spree, I can reveal, is Felix Salmon, the longtime financial columnist and inveterate provocateur. Salmon’s musings on Wall Street, money, and media have made him a hot get for past employers ranging from Condé Nast Portfolio, to Reuters, to Fusion, where he was reportedly being generously compensated before he resigned, rather cryptically, at the beginning of the year, as Fusion Media Group was beginning to implode.

Most recently, Salmon has been hosting Slate’s Money podcast, a gig he’ll maintain as he launches a Sunday newsletter in the style of Swan’s Sneak Peek. The new tip sheet will be called Axios Edge, with “a focus on market trends, business, and economics,” as a spokesperson put it to me. With Axios Edge, the company is signaling an expansion of its coverage of markets and finance, an effort that also will include CNBC alumna Courtenay Brown, another fresh recruit....MORE 
Previously on Felix:
Catfishin': Creating Felix Salmon and the What, Why and How He Got Paid What He Got Paid
Reuters' Felix Salmon is the Columbia Journalism Review’s New Peter G. Peterson Fellow
Felix Salmon Reviews Martin Wolf's "The Shifts and Shocks"
Tart, bordering on acidic.  

And from a 2010 post:

...For those who don't follow this stuff [he means people who have a life -ed] there was a dust-up between Felix and Henry a couple months ago.*
*Felix: "Kicked out of finance, and into journalism"
Henry: "Felix Salmon: Henry Blodget Should Be Banned From The Industry"
Felix: "Disclosing journalists’ pasts"
New York Magazine: "Financial Bloggers Felix Salmon and Henry Blodget Have a Fight, Make Up"

Monday, June 18, 2018

Professor Damodaran on "User and Subscriber Businesses: The Good, the Bad and the Ugly!"

From Musings on Markets:
In a series of posts over the course of the last year, I argued that you can value users and subscribers at businesses, using first principles in valuation, and have used the approach to value Uber ridersAmazon Prime members and Spotify & Netflix subscribers. With each iteration, I have learned a few things about user value and ways of distinguishing between user bases that can create substantial value from user bases that not only are incapable of creating value but can actively destroy it. I was reminded of these principles this week, first as I wrote about Walmart's $16 billion bid for 77% of Flipkart, a deal at least partially motivated by shopper numbers, then again as I read a news story about MoviePass and the potential demise of its "too good to be true" model, and finally as I tripped over a LimeBike on my walk home. 
User Based Value
My attempt to build a user-based valuation model was triggered by a comment that I got on a valuation that I had done of Uber about a year ago on my blog. In that post, I approached Uber, as I would any other business, and valued it, based upon aggregated revenues, earnings and cash flows, discounted back at a company-wide cost of capital. I was taken to task for applying an old-economy valuation approach to a new-economy company and was told that that the companies of today derive their value from customers, users and subscribers. While my initial response was that you cannot pay dividends with users, I realized that there was a core truth to the critique and that companies are increasingly building their businesses around their members. 
Consequently, I went back to valuation first principles, where the value of any asset is a function of its cashflows, growth and risks, and adapted that approach to valuing a user or subscriber:
https://blogger.googleusercontent.com/img/b/R29vZ2xl/AVvXsEgd9qauDbC11JsocvkDQcP31stbtNWZduKSwfKDcvM0vH81TBhFgtbzMGUQLaTazwaRaieWe6J75IOcz_P8x1-5jV0BNL5Q0t_SgKhIsh6vxhEU-kbvLutWujz-l_ZQH_-UeInzw9hXNcg/s1600/existing+user.png
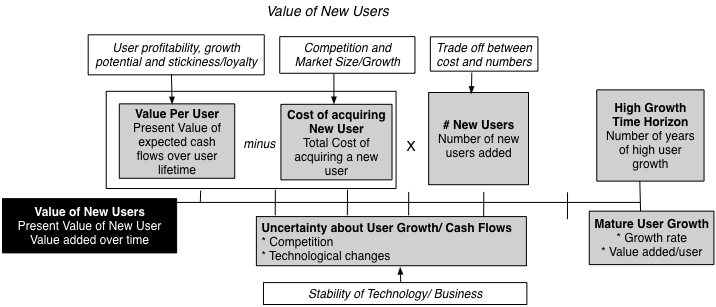
To get from the value of existing users to the value of an entire company, I incorporated the value effect of new users, bringing in the cost of acquiring a new user into the value:
https://blogger.googleusercontent.com/img/b/R29vZ2xl/AVvXsEgmu2NQ-V-fGuZvHTJpkiLsdhSbw3eb_a-SLJQRZPDy0oLejQySrLMh6L3BGp5iFBVz9jyqpU1cfAXXd9PtU0qQTEz1TDNaLM9yq3gRj8KePjZX26jOYfl0FvKyI2jbsMLxX3OfeQ_iBu8/s1600/New+User+Picture.png
I applied closure by consider all corporate costs that are not directly related to users or subscribers in a corporate cost drag, a drag because it reduces the value of the business:...

Sunday, March 25, 2018

Professor Damodaran: "Interest Rates and Stock Prices: It's Complicated!"

From Professor D.'s Musings on Markets, March 2:
Jerome Powell, the new Fed Chair, was on Capitol Hill on February 27, and his testimony was, for the most part, predictable and uncontroversial. He told Congress that he believed that the economy had strengthened over the course of the last year and that the Fed would continue on its path of "raising rates". Analysts have spent the next few days reading the tea leaves of his testimony, to decide whether this would translate into three or four rate hikes and what this would mean for stocks. In fact, the blame for the drop in stocks over the last four trading days has been placed primarily on the Fed bogeyman, with protectionism providing an assist on the last two days. While there may be an element of truth to this, I am skeptical about any Fed-based arguments for market increases and decreases, because I disagree fundamentally with many about how much power central banks have to set interest rates, and how those interest rates affect value.
1. The Fed's power to set interest rates is limited
I have repeatedly pushed back against the notion that the Fed or any central bank somehow sets market interest rates, since it really does not have the power to do so. The only rate that the Fed sets  directly is the Fed funds rate, and while it is true that the Fed's actions on that rate send signals to markets, those signals are fuzzy and do not always have predictable consequences. In fact, it is worth noting that the Fed has been hiking the Fed Funds rate since December 2016, when Janet Yellen's Fed initiated this process, raising the Fed Funds rate by 0.25%. In the months since, the effects of the Fed Fund rate changes on long term rates is debatable, and while short term rate have gone up, it is not clear whether the Fed Funds rate is driving short term rates or whether market rates are driving the Fed.
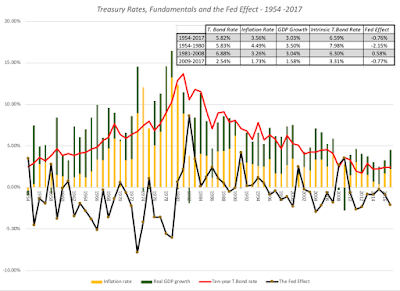
It is true that post-2008, the Fed has been much more aggressive in buying bonds in financial markets in its quantitative easing efforts to keep rates low. While that was  started as a response to the financial crisis of 2008, it continued for much of the last decade and clearly has had an impact on interest rates. To those who would argue that it was the Fed, through its Fed Funds rate and quantitative easing policies that kept long term rates low from 2008-2017, I would beg to differ, since there are two far stronger fundamental factors at play - low or no inflation and anemic real economic growth. In the graph below, I have the treasury bond rate compared to the sum of inflation and real growth each year, with the difference being attributed to the Fed effect:
Download spreadsheet with raw data
You have seen me use this graph before, but my point is a simple one. The Fed is less rate-setter, when it comes to market interest rates, than rate-influencer, with the influence depending upon its credibility. While rates were low in the 2009-2017 time period, and the Fed did play a role (the Fed effect lowered rates by 0.77%), the primary reasons for low rates were fundamental. It is for that reason that I described the Fed Chair as the Wizard of Oz, drawing his or her power from the perception that he or she has power, rather than actual power. That said, the Fed effect at the start of 2018, as I noted in a post at the beginning of the year, is larger than it has been at any time in the last decade, perhaps setting the stage for the tumult in stock and bond markets in the last few weeks....MORE 
The good professor would also like to remind us:
Damodaran Online: There is an App for that! 

Saturday, January 6, 2018

Professor Damodaran's First Post Since October: Data, Data, Data

Did I mention data?
At first exposure these datasets are almost overwhelming but then....wow.

From Aswath Damodaran's Musings on Markets blog, Jan 5:

January 2018 Data Update 1: Numbers don't lie, or do they?
Every year, since 1992, I have spent the first week of my year, paying homage to the numbers gods. I collect raw accounting and market data from a variety of raw data providers, and I am grateful to all of them for making my life easier, and I summarize the data on many dimensions, by geography, by industry and by market capitalization. That summarized data, for the start of 2018, can be found on my website, as can the archived data from prior years
The What?
My dataset includes every publicly traded firm that has a market price available for it, in my raw dataset, and at the start of 2018, it included 43,848 firms, up from the 42,678 firms at the start of 2017. To the question of why I don't restrict myself to just the biggest, the most liquid or the most heavily followed firms, my answer is a statistical one. Any decision that I make on screening the data or sampling will create biases that will color my results, and while I will not claim to be bias-free (no one is), I would prefer to not initiate it with my sampling.
There are 135 countries that are represented in the data, though many have only a handful of firms that are incorporated there. That said, it is worth noting that while the companies are classified by country of incorporation, many have operations in multiple countries. I have classified my firms into five "big" groups: the United States, Europe (EU, UK), Emerging Markets, Japan and Australia/Canada/New Zealand. The pie chart below provides the breakdown:
Download spreadsheet
Since the emerging market grouping includes firms from Asia, Latin America, Africa and Eurasia, I also have the data for sub-groups including India, China, Small Asia (other than India, China and Japan), Latin America, Africa & MidEast and Russia/Eurasia. That is pictured in the second pie chart above.

Within each geographic group, I break the companies down into 94 industry groupings and the numbers in each grouping are summarized at this link. While some would prefer a finer breakdown, I prefer this coarser grouping because it allows for larger sample sizes, especially as I go to sub-groups. Finally, I compute a range of numbers for each grouping, reflecting my corporate finance biases, and classify them into risk, profitability, leverage and cash return measures in the table below:...
...MUCH, MUCH MORE (so much more)

The two posts that preceded the hiatus:

Oct 24
The Bitcoin Boom: Asset, Currency, Commodity or Collectible?
Oct 27 
Bitcoin Backlash: Back to the Drawing Board?

Sunday, October 29, 2017

Professor Damodaren May Have Lost His Mind: Talking Bitcoin

Important note after the jump.

From his personal blog, Musings on Markets, October 24:

The Bitcoin Boom: Asset, Currency, Commodity or Collectible?
As I have noted with my earlier posts on crypto currencies, in general, and bitcoin, in particular, I find myself disagreeing with both its most virulent critics and its strongest proponents.  Unlike Jamie Dimon, I don't believe that bitcoin is a fraud and that people who are "stupid enough to buy it" will pay a price for that stupidity. Unlike its biggest cheerleaders, I don't believe that crypto currencies are now or ever will be an asset class or that these currencies can change fundamental truths about risk, investing and management. The reason for the divide, though, is that the two sides seem to disagree fundamentally on what bitcoin is, and at  the risk of raising hackles all the way around, I will argue that bitcoin is not an asset, but a currency, and as such, you cannot value it or invest in it. You can only price it and trade it.

Assets, Commodities, Currencies and Collectibles
Not everything can be valued, but almost everything can be priced. To understand the distinction between value and price, let me start by positing that every investment that I will look at has to fall into one of the following four groupings:
  1. Cash Generating Asset: An asset generates or is expected to generate cash flows in the future. A business that you own is definitely an asset, as is a claim on the cash flows on that business. Those claims can be either contractually set (bonds or debt), residual (equity or stock) or even contingent (options). What assets share in common is that these cash flows can be valued, and assets with high cash flows and less risk should be valued more than assets with lower cash flows and more risk. At the same time, assets can also be priced, relative to each other, by scaling the price that you pay to a common metric. With stocks, this takes the form of comparing pricing multiples (PE ratio, EV/EBITDA, Price to Book or Value/Sales) across similar companies to form pricing judgments of which stocks are cheap and which ones are expensive.
  2. Commodity: A commodity derives its value from its use as raw material to meet a fundamental need, whether it be energy, food or shelter. While that value can be estimated by looking at the demand for and supply of the commodity, there are long lag and lead times in both that make that valuation process much more difficult than for an asset. Consequently, commodities tend to be priced, often relative to their own history, with normalized oil, coal wheat or iron ore prices being computed by averaging prices across long cycles.
  3. Currency: A currency is a medium of exchange that you use to denominate cash flows and is a store of purchasing power, if you choose to not invest. Standing alone, currencies have no cash flows and  cannot be valued, but they can be priced against other currencies. In the long term, currencies that are accepted more widely as a medium of exchange and that hold their purchasing power better over time should see their prices rise, relative to currencies that don't have those characteristics. In the short term, though, other forces including governments trying to manipulate exchange rates can dominate. Using a more conventional currency example, you can see this in a graph of the US $ against seven fiat currencies, where over the long term (1995-2017), you can see the Swiss Franc and the Chinese Yuan increasing in price, relative to the $, and the Mexican Peso, Brazilian Real, Indian Rupee and British Pound, dropping in price, again relative to the $......               
  4. Collectible: A collectible has no cash flows and is not a medium of exchange but it can sometimes have aesthetic value (as is the case with a master painting or a sculpture) or an emotional attachment (a baseball card or team jersey). A collectible cannot be valued since it too generates no cash flows but it can be priced, based upon how other people perceive its desirability and the scarcity of the collectible.  
Viewed through this prism, Gold is clearly not a cash flow generating asset, but is it a commodity? Since gold's value has little to do with its utilitarian functions and more to do with its longstanding function as a store of value, especially during crises or when you lose faith in paper currencies, it is more currency than commodity. Real estate is an asset, even if it takes the form of a personal home, because you would have had to pay rental expenses (a cash flow), in its absence. Private equity and hedge funds are forms of investing in assets, currencies, commodities or collectibles, and are not separate asset classes. 
Investing versus Trading
The key is that cash generating assets can be both valued and priced, commodities can be priced much more easily than valued, and currencies and collectibles can only be priced. So what? I have written before about the divide between investing and trading and it is worth revisiting that contrast. To invest in something, you need to assess its value, compare to the price, and then act on that comparison, buying if the price is less than value and selling if it is greater. Trading is a much simpler exercise, where you price something, make a judgment on whether that price will go up or down in the next time period and then make a pricing bet. While you can be successful at either, the skill sets and tool kits that you use are different for investing and trading, and what makes for a good investor is different from the ingredients needed for good trading. The table below captures the difference between trading (the pricing game) and investing (the value game).

The Pricing Game
The Value Game
Underlying philosophy
The price is the only real number that you can act on. No one knows what the value of an asset is and estimating it is of little use.
Every asset has a fair or true value. You can estimate that value, albeit with error, and price has to converge on value (eventually).
To play the game
You try to guess which direction the price will move in the next period(s) and trade ahead of the movement. To win the game, you have to be right more often than wrong about direction and to exit before the winds shift.
You try to estimate the value of an asset, and if it is under(over) value, you buy (sell) the asset. To win the game, you have to be right about value (for the most part) and the market price has to move to that value
Key drivers
Price is determined by demand & supply, which in turn are affected by mood and momentum.
Value is determined by cash flows, growth and risk.
Information effect
Incremental information (news, stories, rumors) that shifts the mood will move the price, even if it has no real consequences for long term value.
Only information that alter cash flows, growth and risk in a material way can affect value.
Tools of the game (1) Technical indicators, (2) Price Charts (3) Investor Psychology (1) Ratio analysis, (2) DCF Valuation (3) Accounting Research
Time horizon
Can be very short term (minutes) to mildly short term (weeks, months).
Long term
Key skill
Be able to gauge market mood/momentum shifts earlier than the rest of the market.
Be able to “value” assets, given uncertainty.
Key personality traits
      (1) Market amnesia (2) Quick Acting (3) Gambling Instincts
      (1) Faith in “value” (2) Faith in markets (3) Patience (4) Immunity from peer pressure
Biggest Danger(s)
Momentum shifts can occur quickly, wiping out months of profits in a few hours.
The price may not converge on value, even if your value is “right”.
Added bonus
Capacity to move prices (with lots of money and lots of followers).
Can provide the catalyst that can move price to value.
Most Delusional Player
A trader who thinks he is trading based on value.
A value investor who thinks he can reason with markets.

As I see it, you can play either the value or pricing game well, but being delusional about the game you are playing, and using the wrong tools or bringing the wrong skill set to that game, is a recipe for disaster.

What is Bitcoin?
The first step towards a serious debate on bitcoin then has to be deciding whether it is an asset, a currency, a commodity or collectible. Bitcoin is not an asset, since it does not generate cash flows standing alone for those who hold it (until you sell it).  It is not a commodity, because it is not raw material that can be used in the production of something useful. The only exception that I can think off is that if it becomes a necessary component of smart contracts, it could take on the role of a commodity; that may be ethereum's saving grace, since it has been marketed less as a currency and more as a smart contracting lubricant.  The choice then becomes whether it is a currency or a collectible, with its supporters tilting towards the former and its detractors the latter. I argued in my last post that Bitcoin is a currency, but it is not a good one yet, insofar as it has only limited acceptance as a medium of exchange and it is too volatile to be a store of value. Looking forward, there are three possible paths that I see for Bitcoin as a currency, from best case to worst case.
  1. The Global Digital Currency: In the best case scenario, Bitcoin gains wide acceptance in transactions across the world, becoming a widely used global digital currency. For this to happen, it has to become more stable (relative to other currencies), central banks and governments around the world have to accept its use (or at least not actively try to impede it) and the aura of mystery around it has to fade. If that happens, it could compete with fiat currencies and given the algorithm set limits on its creation, its high price could be justified.
  2. Gold for Millennials: In this scenario, Bitcoin becomes a haven for those who do not trust central banks, governments and fiat currencies. In short, it takes on the role that gold has, historically, for those who have lost trust in or fear centralized authority. It is interesting that the language of Bitcoin is filled with mining terminology, since it suggests that intentionally or otherwise, the creators of Bitcoin shared this vision. In fact, the hard cap on Bitcoin of 21 million is more compatible with this scenario than the first one. If this scenario unfolds, and Bitcoin shows the same staying power as gold, it will behave like gold does, rising during crises and dropping in more sanguine time periods.  
  3. The 21st Century Tulip Bulb: In this, the worst case scenario, Bitcoin is like a shooting star, attracting more money as it soars, from those who see it as a source of easy profits, but just as quickly flares out as these traders move on to something new and different (which could be a different and better designed digital currency), leaving Bitcoin holders with memories of what might have been. If this happens, Bitcoin could very well become the equivalent of Tulip Bulbs, a speculative asset that saw its prices soar in the sixteen hundreds in Holland, before collapsing in the aftermath.
I would be lying if I said that I knew which of these scenarios will unfold, but they are all still plausible scenarios. If you are trading in Bitcoin, you may very well not care, since your time horizon may be in minutes and hours, not weeks, months or years. If you have a longer term interest in Bitcoin, though, your focus should be less on the noise of day-to-day price movements and more on advancements on its use as a currency. Note also that you could be a pessimist on Bitcoin and other crypto currencies but be an optimist about the underlying technology, especially block chain, and its potential for disruption.

Reality Checks
Combining the section where I classified investments into assets, commodities, currencies and collectibles with the one where I argued that Bitcoin is a "young" currency allows me to draw the following conclusions:...MORE
NOTE: This was followed on October 27 by:

Bitcoin Backlash: Back to the Drawing Board?