I have always found it helpful that S&P uses ten, and only ten, industry groups in the 500.*
The quick-and-dirty approach to this presentation is to locate the monthly return of the aggregate 500 for the month (white box), out-performers appear to the left, and under-performers will appear to the right. Simplicity itself.
From Energy Musings,August 2:
Higher Oil Prices Drive Energy Stock Recovery
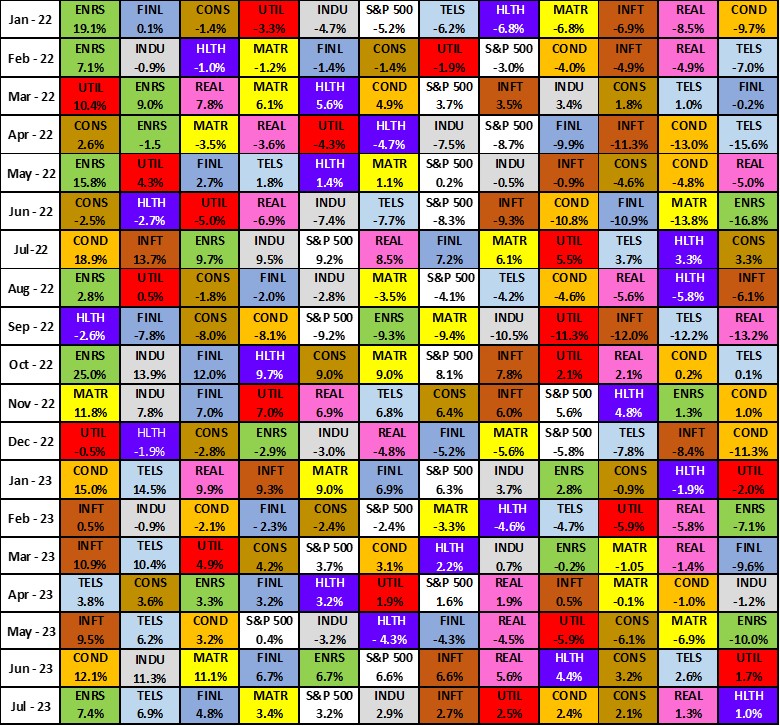
After six months of poor performance, Energy was the best-performing S&P 500 Index sector for July. Energy rose 7.4% during the month, more than doubling the overall market’s gain. Our chart shows S&P 500 sector performance monthly from January 2022 through July 2023. With Energy in green, one only needs to examine the chart to see how well Energy performed in 2022 and then did so poorly for the first half of 2023.
Exhibit 2. S&P 500 Index Monthly Sector Performance 2022-2023 YTD
Source: S&P Global; author