We'll add a bit after the chart:
XLE Heading for Painville
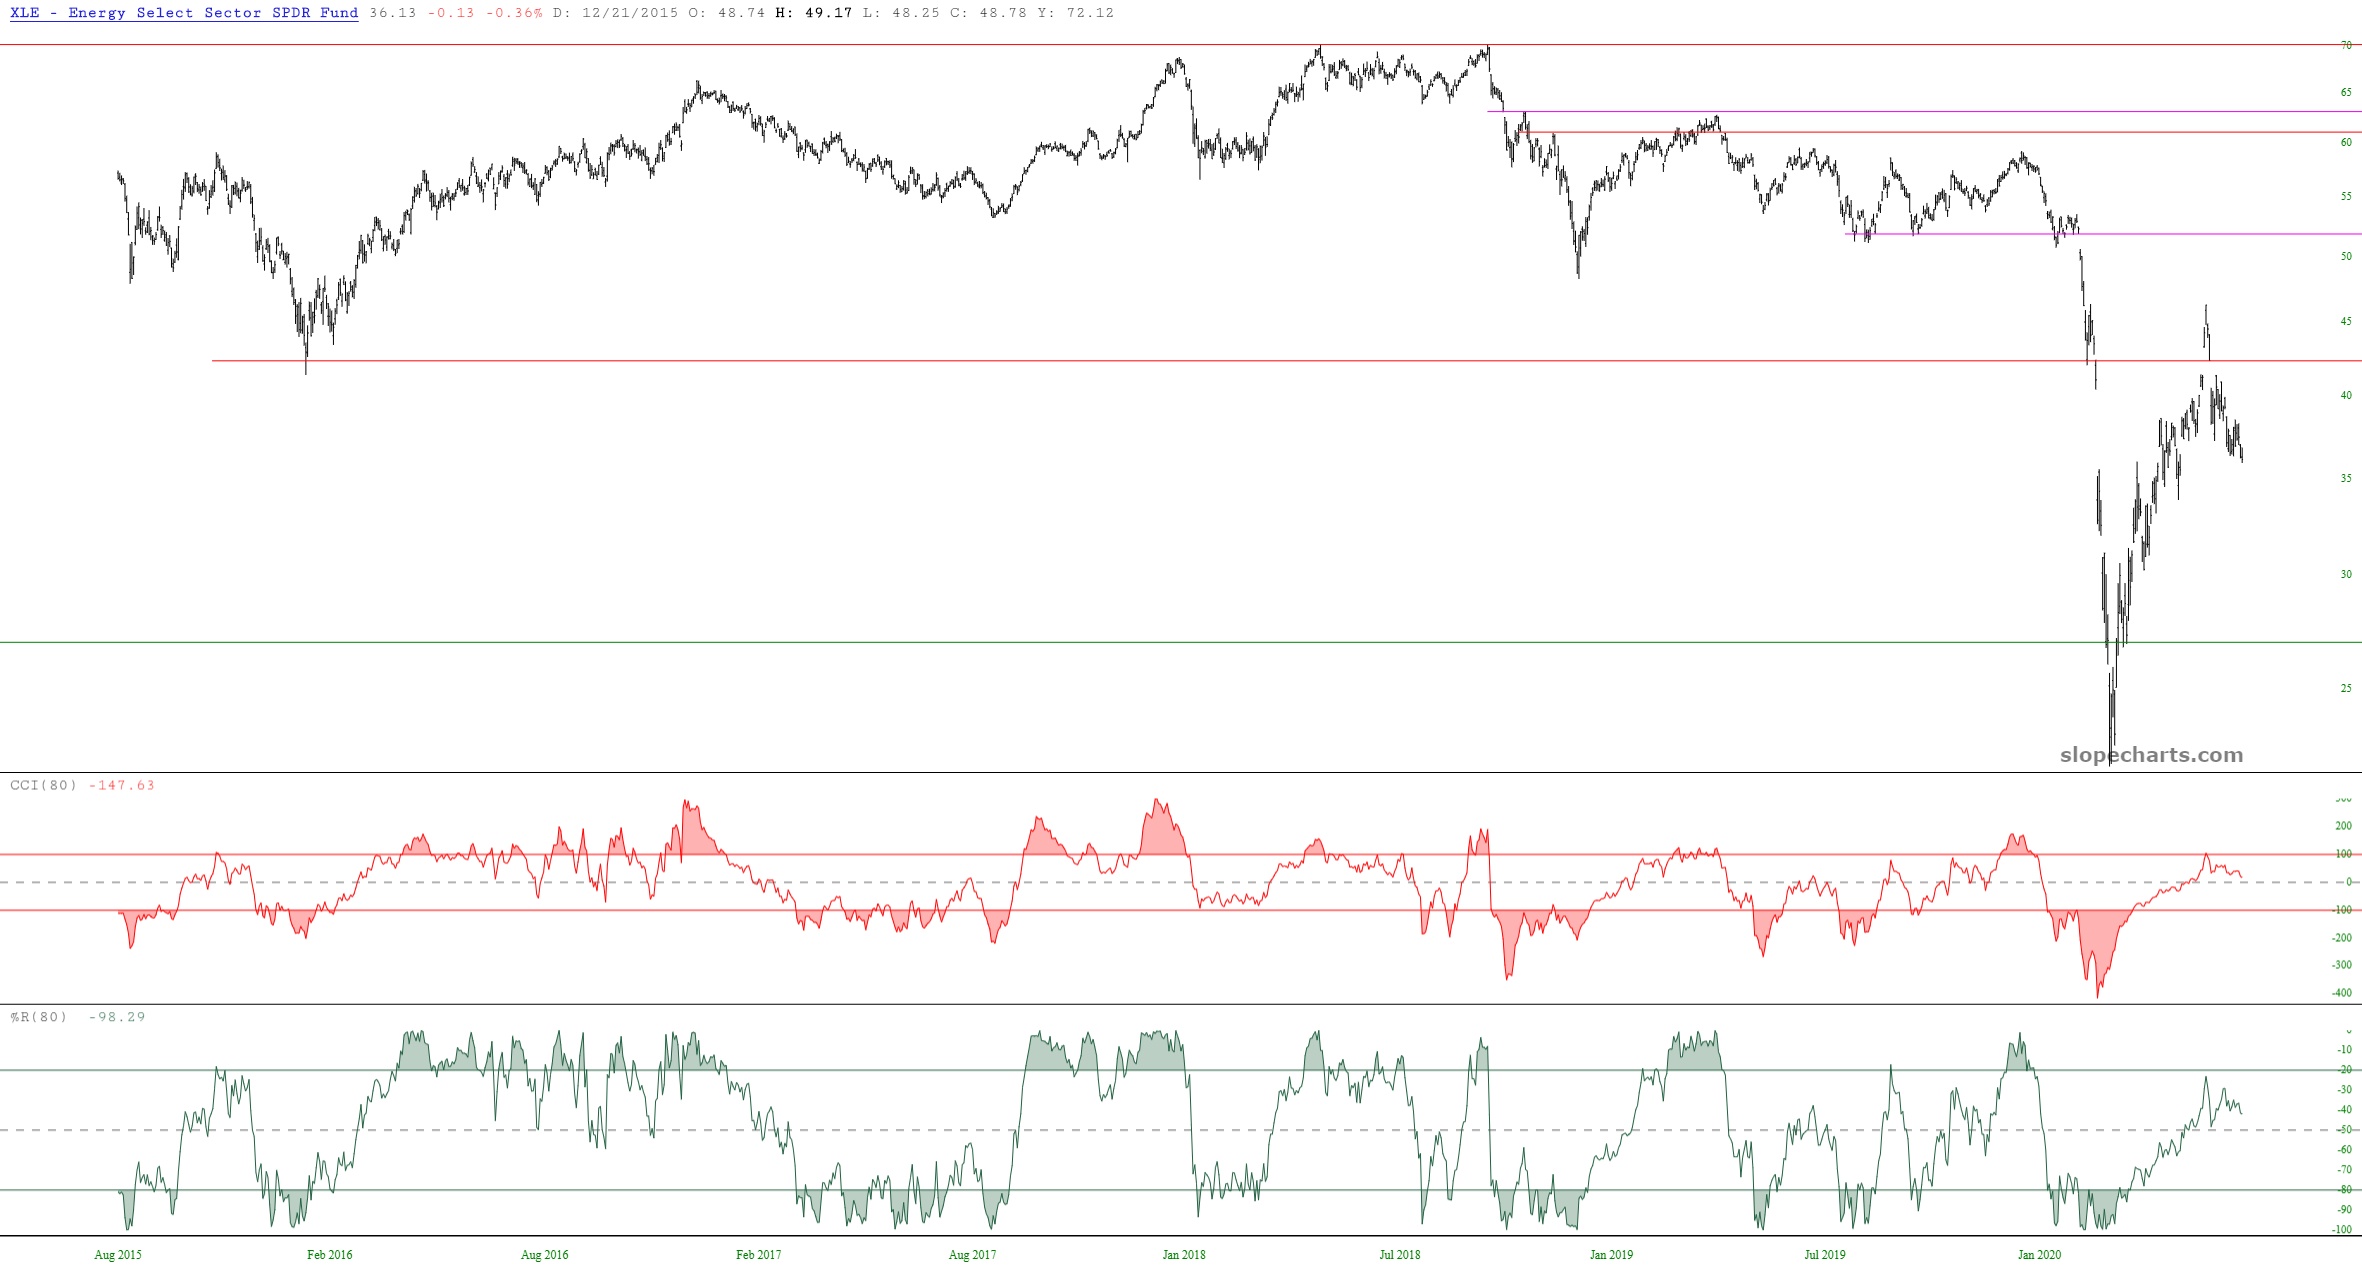
...MORE
XLE close July 8: $36.23 down 0.03 (-0.08%)
Checking in with Thomas Bulkowski for his comments on island reversals—those four daily prints that poke above the red line, with a gap up and a gap down defining the island:
....Island Reversal Identification Guidelines....MORE
Characteristic Discussion Price trend Tops have price trending upward to the island; bottoms have price trending downward. Shape Gaps separate a price island from the mainland. Gaps Two gaps must share some or all of the same price. Volume High on the day price makes the second gap. Duration The island can be one day to several months long. *****Important Bull Market Results for Island Reversals
Overall performance rank for up/down breakouts (1 is best): 35 out of 56 (bottoms)/38 out of 53 (tops)
Break even failure rate for up/down breakouts: 31%; 32%
Average rise/decline: 32%; 13%
Throwback/pullback rate: 54%; 55%
Percentage meeting price target for up/down breakouts: 79%; 60%