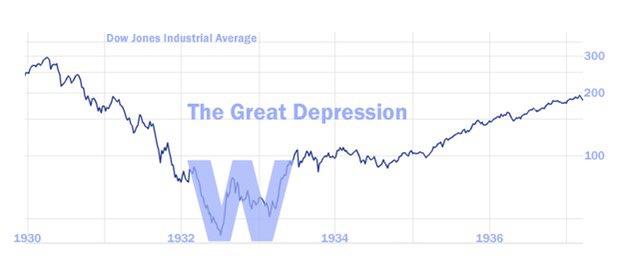
He pointed out the low middle peak in Andale Mono (or the Courier font, above) versus the high middle peak seen in the Great Depression, represented here in Helvetica Bold:
We've also seen the reversed radical sign recovery (not very encouraging):
Figure 2 — A reverse (horizontally flipped) square root symbol.
And have even considered Albert Edwards' Armenian K, brought to us by Alphaville's founder Paul Murphy back in June 2009:

...And he’s at pains to stress that his beloved Coppock Indicator may be giving a premature buy signal.So now you know two things.
But it’s here in pixalated black and white:
This is one of the most reliable technical indicators, suggesting we are in a new long-term bull market.
The terrifying possibility of a market that appears to be recovering almost vertically, only to collapse straight down.
And that Albert was bullish coming out of the GFC, a fact many would never believe if not captured and memorialized at FT Alphaville.
Now where was I?
Ah, from Upfina, July 27:
In a previous article, we mentioned the combined total of unemployment claims looked depressionary. That’s a big statement because there are some still calling for a V shaped recovery. There was a V shaped recovery in housing as new home sales in June hit a 13 year high, but there wasn’t a V shaped recovery in the labor market even though the May and June labor reports were very good.
We aren’t saying the economy is in a depression, but many labor market data points look bad. The July BLS report will shock the people who see a V shaped recovery. It will surprise those who only started to realize the economy is weakening when adjusted initial claims increased. The weak report will be reiterated by the retail sales reading which should be weak as Chase card spending growth hit a 5 week low on July 20th and consumer confidence has been waning.
Relevant for the
UI benefits debate-  job postings per searching unemployed has fallen by
 about 50% since before the pandemic.  1/ pic.twitter.com/6kaSjXUBVv
— Eliza Forsythe (@ElizaForsythe) July 24, 2020
The chart above shows the number of job postings per people searching for jobs has fallen 50% since the recession started. More importantly, there has been no increase since May. This looks like when a PMI reading falls way below 50 (current economic activity worse than the prior month) and then rises back near 50. Fifty means no improvement. If the economy didn’t improve from the bottom, it’s an L-shaped recovery. The flash July composite PMI rose from 47.9 to 50 which was a 6 month high. Manufacturing had a 51.3 PMI and services had a 49.6 PMI. Just getting back to 50 doesn’t mean the economy has fully recovered (for services, it’s getting worse at a lower rate).....MUCH MORE
The theory is manufacturing is more linked to the global economy which might be doing better than America because America is reeling from COVID-19 more than most countries. Manufacturing might be considered more essential. It also might be more used to big declines and rebounds because it’s more cyclical. Either way, services employs much more workers, so if that sector underperforms, the labor market will be hurt....