From Wolf Street, July 3:
Fed shifts to propping up consumption by businesses and governments, and away from propping up asset prices.
The Fed added some assets and shed other assets, and the net effect on the balance sheet for the week ended July 1, released Thursday afternoon, was that total assets dropped by $76 billion, after having dropped by $12 billion a week ago, and by $74 billion two weeks ago. That three-week drop of $163 billion was far faster than any three-week decline during the official QE unwind from late 2017 into 2019:
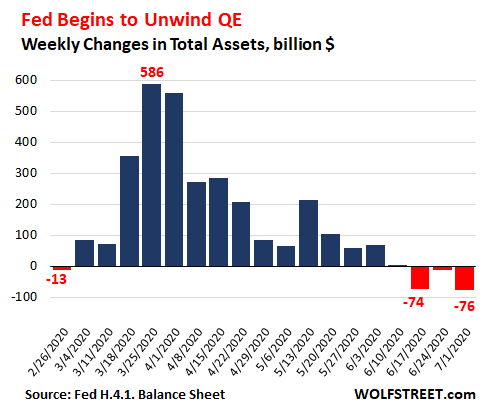
The chart above shows how the Fed front-loaded QE when the crisis erupted, throwing $1.5 trillion at it in the first four weeks, when financial markets came unglued and when credit was freezing up, and when investors in overleveraged hedge funds, mortgage-REITs, and other risk-takers were about to learn a lesson about capitalism – which the Fed’s bailout made sure they didn’t have to learn.
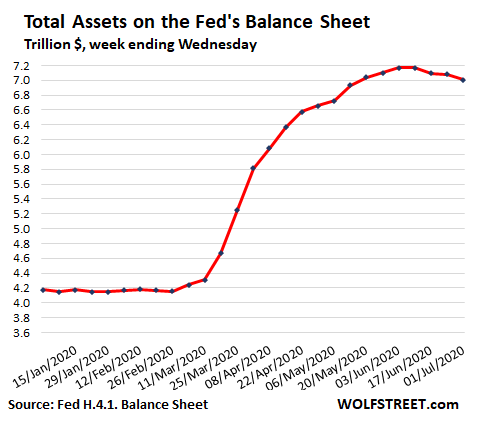
The $163-billion decline in total assets over the past three weeks brought the Fed’s assets down to a still mind-blowing $7.01 trillion.
The curve in the chart below shows the sudden ramp-up, the fairly quick taper, and then, over the past three weeks the drop. This was planned from the beginning: Give it all up-front but don’t let it drag out for years as last time:
Central-bank liquidity-swaps dropped by $50 billion.The Fed’s “dollar liquidity swap lines” with other central banks fell by $50 billion in the week ended July 1 to $225 billion, the third week in a row of declines. They have now dropped by half over those three weeks........MUCH MORE