From Nautil.us:
Our brain is constantly picturing what the future should be.
Norman Triplett was a pioneer in the psychology of magic, and back in 1900, he published a wonderful scientific paper on magic that, among many other things, discusses an experiment on an intriguing magical illusion. A magician sat at a table in front of a group of schoolchildren and threw a ball up in the air a few times. Before the final throw, his hand secretly went under the table, letting the ball fall onto his lap, after which he proceeded to throw an imaginary ball up in the air.
Described like this, it does not sound like an amazing trick, but what was truly surprising is that more than half of the children claimed to have seen an illusory ball—what Triplett referred to as a “ghost ball”—leave the magician’s hand and disappear somewhere midway between the magician and the ceiling. This was clearly an illusion because on the final throw, no ball had left his hand; the children had perceived an event that never took place.
Triplett carried out several studies using this illusion, and he came to some rather interesting, though not necessarily correct, conclusions. He thought that the illusion resulted from retinal afterimages, or in his own words, “What the audience sees is an image of repetition, which is undoubtedly partly the effect of a residual stimulation in the eye, partly a central excitation.”
DO YOU BELIEVE IN MAGIC?:
Why do normal people maintain magical beliefs? They reflect
the biases
and quirks found in our everyday cognition, says psychologist and
magician Gustav Kuhn
At the time, this seemed to be a reasonable suggestion. I came across Triplett’s paper in my early days of researching scientific studies on magic, and I was intrigued by this illusion. Triplett’s Vanishing Ball Illusion relies on a principle that I often used to vanish objects, so I had some ideas as to why the illusion worked. I was skeptical about Triplett’s explanation, and I knew from experience that the illusion relies on misdirecting the audience’s expectations so that they anticipate you throwing the ball for real. A person’s eye gaze provides one of the most powerful tools to misdirect expectations, and so I embarked on one of my first scientific projects to study the role that social cues play in driving this illusion.Related:
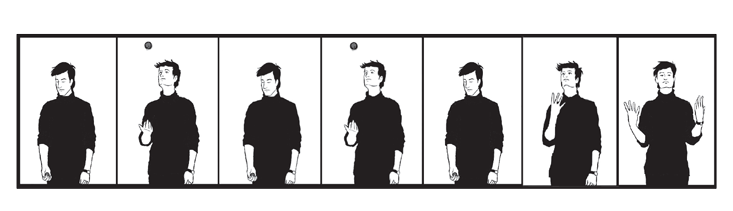
I recorded two different versions of the Vanishing Ball Illusion. In the normal version, I threw the ball up in the air twice, before secretly palming it in my hand and simply pretending to throw it up in the air (as shown in the image above). Importantly my gaze followed the ball, and in the pretend throw, my gaze followed the imaginary trajectory of the ball. In a different version of the trick, I carried out exactly the same actions, but this time, my gaze did not follow the imaginary ball. Instead, I stared at the hand that was palming the ball. Triplett’s account of retinal afterimages predicts that both versions of the trick should be equally effective, because both groups of participants observed exactly the same sequence of events and thus had the same sensory stimulation.,,,MUCH MORE
"Magic AI: These are the Optical Illusions that Trick, Fool, and Flummox Computers"
Chartology: Monster “Mega-Phone” pattern breakout near?
You have to be careful with this stuff.
Humans are pattern-recognizing machines and are so good at it that we can see patterns that don't even exist.* In the instant case you really have to beware of imputing meaning to lines on charts; the reason technical analysis has any validity at all is because of "market memory" one example of which is resistance to upmoves caused by prior investors waiting to "get even and get out" and supplying stock to the market.
(one of the reasons to like new highs, no overhead supply)
In these long term chart there is no market memory, for example there are very few people with positions established at the Aug. 24, 1987 2722 DJIA high which is used as the basis of one of the trendlines shown here.
*On the other hand here's an example of what incisive pattern recognition can accomplish. This chart is from early June 2007 and foresaw what was coming:
Technical Analysis: S&P Black Swan Formation

"The very rare black swan formation - note both feet and neck are complete and the
rare vampire tooth variation is in place. This is very bad. Very very bad."...
