Friday, September 30, 2016

Hurricane Watch: "Matthew Becomes the Atlantic's First Category 5 Hurricane in Nine Years"

From Wunderblog:
Extending a jaw-dropping stretch of rapid intensification, Hurricane Matthew has become the Atlantic's first Category 5 hurricane since Felix in 2007. Matthew's top sustained winds were set at 160 mph in the 11 pm EDT update from the National Hurricane Center. The upgrade was based on radiometer-measured near-surface winds as high as 143 knots (165 mph] gathered in a Hurricane Hunter flight on Friday evening. Now located less than 100 miles north of the Colombian coastline, Matthew continues to move just south of due west at about 7 mph.

Matthew is the planet’s fifth Category 5 storm of the year. The others were Tropical Cyclone Winston, which devastated Fiji in the Southwest Pacific in February; Tropical Cyclone Fantala from May, in the Southwest Indian Ocean; Super Typhoon Nepartak from July, in the Northwest Pacific Ocean; and Super Typhoon Meranti in the Northwest Pacific, which struck the small Philippine island of Itbayat Island while at peak strength in September. Super Typhoon Meranti was the most intense Category 5 of the year, with sustained winds of 185 mph and a central pressure of 890 mb. The globe averages between 4 and 5 Category 5 storms per year.

In records going back to 1924, only five Atlantic hurricanes are on record as having Category 5 strength this late in the year--all of them in the Caribbean, the region where sufficiently warm waters and favorable atmospheric conditions are most likely to occur this late in the season. Shown with their date spans at Category 5 strength, these are:
"Cuba": October 19, 1924
"Cuba": November 5-8, 1932
Hattie: October 30-31, 1961
Mitch: October 26-28, 1998
Wilma: October 19, 2005
More background from our earlier post
There's been little change so far in the outlook for Matthew, although we'll be watching tonight's 00Z Saturday model runs closely to see what comes next. Below is more context on Matthew's past, present, and future, mostly brought over from our post earlier this afternoon. We will be posting regular updates through the weekend, typically between 10 am and noon EDT and between 6 and 8 pm EDT. For those new to our blog, the comments section is packed with valuable insights from our many members, including meteorologists as well as dedicated laypeople.

Bob Henson and Jeff Masters

How did Matthew get so strong so quickly?
Vertical wind shear of up to 20 knots has plagued Matthew for most of the last two days, yet the storm has not only maintained its structure but grown at a ferocious rate. Dissertations may be written on how this happened! Working in Matthew’s favor has been a steadily moistening atmosphere along its westward path, which means that the shearing winds didn’t push too much dry air into Matthew. Once it developed a central core, Matthew was able to fend off the wind shear much more effectively. In addition, water temperatures are unusually warm throughout the Caribbean (and the entire western North Atlantic), with an area of high oceanic heat content directly beneath Matthew’s path. Such deep oceanic heat allows a storm to strengthen without churning up cooler waters from below that could blunt the intensification....MUCH MORE 
Earlier today:
Hurricane Matthew Rapidly Intensifies
Wednesday
Hurricane Watch: "Tropical Storm Matthew Forms in the Lesser Antilles Islands"

Ensemble of storm track models:

Hurricane Matthew

Earthquake Watch: "Massive Earthquake Along the San Andreas Fault Is Disturbingly Imminent"

From Gizmodo (formerly a Gawker property):

https://i.kinja-img.com/gawker-media/image/upload/s--XpvLUxSu--/c_scale,fl_progressive,q_80,w_800/e1vkmed0sohnyhr0gaar.jpg
The USGS estimates a 1 in 100 chance of the San Andreas Fault rupturing between now and October 4. 
(Image:SanAndreasFault.org)
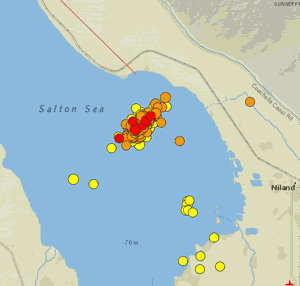
A series of quakes under the Salton Sea may be a signal that the San Andreas Fault is on the verge of buckling. For the next few days, the risk of a major earthquake along the fault is as high as 1 in 100. Which, holy crap.

The United States Geological Survey has been tracking a series of earthquakes near Bombay Beach, California. This “earthquake swarm” is happening under the Salton Sea, and over 140 events have been recorded since Monday September 26. The quakes range from 1.4 to 4.3 in magnitude, and are occurring at depths between 2.5 to 5.5 miles (4 to 9 km).

For seismologists, these quakes could represent some seriously bad news. The swarm is located near a set of cross-faults that are connected to the southernmost end of the San Andreas Fault. Troublingly, some of these cross-faults could be adding stress to the San Andreas Fault when they shift and grind deep underground. Given this region’s history of major earthquakes, it’s got some people a bit nervous.

https://i.kinja-img.com/gawker-media/image/upload/s--ZQ6Oczn1--/xepkwhiqfrbi24tijris.gif
Calculations show that from now until October 4, the chance of a magnitude 7 or greater earthquake happening along the Southern San Andreas Fault is as high as 1 in 100, and as low as 1 in 3,000. On the plus side, the likelihood of it happening decreases with each passing day. These estimates are based on models developed to assess the probabilities of earthquakes and aftershocks in California.
“Swarm-like activity in this region has occurred in the past, so this week’s activity, in and of itself, is not necessarily cause for alarm,” cautions the USGS.

That being said, this is only the third swarm that has been recorded in this area since sensors were installed in 1932, and it’s much worse than the ones recorded in 2001 and 2009. This particular stretch of the San Andreas Fault hasn’t ruptured since 1680, and given that big quakes in this area happen about once every 150 to 200 years, this fault line is considerably overdue....MORE

Oracle Purchases Marriott Hotel in San Mateo (ORCL)

From Curbed, San Francisco:

http://cache.marriott.com/propertyimages/s/sfosa/sfosa_main01.jpg
Well, this is a strange one, isn’t it?
Billed as being “part of Oracle’s expansion into the hospitality business,” the Redwood City software company closed a major deal this Wednesday with the massive San Mateo Marriott near SFO.
Larry Ellison’s corporation bought the 476-suite hotel for a sweet $132 million. Ellison himself personally owns several hotel properties around the world—the Four Seasons Resort in Hawaii and the Epiphany Hotel in Palo Alto—but this is the first hotel purchase for his company.

The Marriott will still operate as usual, even as it undergoes a renovation. As to exactly why the company bought a seemingly nondescript hotel next to an airport, San Francisco Chronicle has more:
“We were finding it more and more difficult to find space to conduct our training,” said Mike Bangs, Oracle’s vice president for headquarters real estate and facilities.
“We generally hire college graduates and train them for two to three weeks,” up to 300 people at a time, two or three times per year, Bangs said. The company likes to house them near its headquarters, which is about 4 miles away. It also will use the hotel for other company events....
...MORE

I think Larry's yacht is bigger:

http://www.findexamples.com/wp-content/uploads/2013/02/Larry-Ellison-The-Rising-Sun-Yacht.jpg

And at $200 $130 million it is definitely more less expensive
(my mistake, he sold the bigger boat to David Geffen, memory's obviously going to hell)

USDA Quarterly Grain Inventory Reports For Sept. 30, 2016

December wheat 399, unchanged, after trading down to 390, approaching the life-of-contract low (386'6, Aug. 31):


From Reuters:

UPDATE 1-U.S. wheat stocks biggest since '87; corn, soy above 2015-USDA
U.S. wheat supplies ballooned to the biggest in nearly 30 years during the summer months, topping expectations, as a 12 percent jump in production and weak demand on the export market filled storage bins, the government said on Friday.

The U.S. Agriculture Department also reported corn and soybean stocks as of Sept. 1 at multi-year highs despite record usage of both commodities during the June, July and August time period.
In its quarterly stocks report, the USDA said that wheat stocks as of Sept. 1 stood at 2.527 billion bushels, the biggest since 1987. Analysts, on average, had been expecting wheat stocks of 2.402 billion bushels, according to the average of estimates given in a Reuters poll.

Corn stocks were 1.738 billion bushels, the biggest since 2006, and soybean stocks were at a five-year high of 197 million bushels. Analysts were expecting corn stocks of 1.754 billion bushels and soybean stocks of 201 million bushels.

A year ago, wheat stocks stood at 2.097 billion bushels, corn stocks stood at 1.731 billion bushels and soybean stocks stood at 191 million bushels.

Chicago Board of Trade soft red winter wheat futures sank to their lowest in nearly a month immediately after the report was released. Prices quickly recovered but remained in negative territory.
Corn futures, which were trading in negative territory before the report, turned higher and soybean futures dipped briefly before returning to pre-report levels.

"Everything came in almost spot-on expectations," said Joe Lardy, analyst at CHS Inc. "For once we didn't get a massive curve ball. "Now we can focus on the critical issues, of what are the yields and what does harvest look like for corn and soybeans."

The drawdown in soybean stocks for the three months ended Sept. 1 totaled 675 million bushels. Corn disappearance was 2.975 billion bushels....MORE

Corn up 5'2 at 334'4.

HERE's the USDA Grains Stocks page.

"Too early to say hedge fund reinsurance model is a failure: A.M. Best"

And that's only the runner-up for headline of the week.

From Artemis:
Adverse economic conditions and reinsurance market turmoil has challenged industry participants throughout 2015 and into 2016, with hedge fund reinsurers being no exception, but it’s still too early to call this approach a failure, according to A.M. Best.

The global reinsurance industry continues to evolve, leading market participants both old and new to adopt varied business models in order to navigate the challenging environment, underlined by an abundance of capital, low investment returns, and ultimately lower rates.

The growth of the convergence space has arguably been one of the key drivers of change in the sector in more recent times, as companies look to work with and against the growing base of insurance-linked securities (ILS) capital and solutions to improve their market relevance.

One manifestation of the wealth of convergence capital, says A.M. Best, is the emergence of the hedge fund reinsurer, which seeks to utilise both the underwriting and investment side of the balance sheet, with the latter being the main driver of performance.

With interest rates remaining dangerously low, investment returns for hedge fund style reinsurance companies have suffered, which, being the main driver of company performance has hindered results in recent months.

At the same time, the softening reinsurance market cycle across the majority of business lines and geographies has dampened underwriting returns for all in the space, contributing to further struggles for both the hedge fund and more traditional players.

“While investment and overall performance has been disappointing, it is too early to jump to the conclusion that the Hedge Fund Re model does not work. The level of investment volatility experienced is not unexpected and is contemplated in our various stress tests....MORE

Natural Gas: EIA Supply/Demand Report

As mentioned in the ag commodity post below:
Today's reports and next month's WASDE are the last reports before the Northern Hemisphere harvests are in so we're getting ready to turn our attention to natural gas again.
'And the seasons they go round and round...'
From the Energy Information Administration:
...Overview:
(For the Week Ending Wednesday, September 28, 2016)
  • Natural gas spot prices fell at most locations this report week (Wednesday, September 21 to Wednesday, September 28). The Henry Hub spot price fell from $3.14 per million British thermal units (MMBtu) last Wednesday to $2.98/MMBtu yesterday.
  • At the New York Mercantile Exchange (Nymex), the October 2016 contract expired yesterday at $2.952/MMBtu, down 11¢ from last Wednesday. The November 2016 contract fell to $3.002/MMBtu, down 13¢ from last Wednesday to yesterday.
  • Net injections into storage totaled 49 Bcf, compared with the five-year (2011–15) average net injection of 97 Bcf and last year's net injection of 99 Bcf during the same week. Working gas stocks total 3,600 Bcf, 220 Bcf above the five-year average and 90 Bcf above last year at this time.
  • The natural gas plant liquids composite price at Mont Belvieu, Texas, rose by 19¢, closing at $5.21/MMBtu for the week ending September 23. The price of natural gasoline, ethane, propane, butane, and isobutane all rose, increasing by 1%, 3%, 6%, 4%, and 4%, respectively.
  • According to Baker Hughes, for the week ending Friday, September 23, the natural gas rig count increased by 3 to 92. The number of oil-directed rigs rose by 2 to 418. The total rig count climbed by 5, and it now stands at 511.
... Storage:
Injections to storage continue at slower-than-normal rate. Net injections into storage totaled 49 Bcf, compared with the five-year (2011–15) average net injection of 97 Bcf and last year's net injections of 99 Bcf during the same week. Working gas stocks total 3,600 Bcf, which is 220 Bcf above the five-year average and 90 Bcf above last year at this time. When the refill season began on April 1, working gas stocks were 874 Bcf above the five-year average....

... Net injections fall below range of market expectations, early trading moves prices ahead of release. Estimates of net injections into storage ranged from 52 Bcf to 68 Bcf, with a median of 53 Bcf. For the second week in a row, early trading seconds ahead of the release of EIA's Weekly Natural Gas Storage Report (WNGSR) occurred. Several seconds prior to the WNGSR release, the price of the Nymex contract for November delivery at the Henry Hub was $2.96/MMBtu. Early trading before the release moved the price of the November contract to $2.98/MMBtu, and at the release of the WNGSR, the price of the November futures contract reached $3.00/MMBtu during relatively light trading. Prices reached $3.02/MMBtu within two minutes of the release.

Spread to the January futures price remains close to year-ago levels. During the most recent storage week, the average natural gas spot price at the Henry Hub was $3.05/MMBtu, while the Nymex futures price of natural gas for delivery in January 2017 averaged $3.38/MMBtu, a difference of 33¢. A year ago, the premium was 32¢.

Temperatures remain higher than normal. Temperatures in the Lower 48 states averaged 73°F, 7°F higher than the normal and 4°F higher than last year at this time. Cooling degree days (CDD) in the Lower 48 states totaled 62, compared with 42 last year and a normal of 32....
...MUCH MORE

FT Alphaville Proposes A Fix For Deutsche Bank, Stock Rises 6% (DB)

The stock is up 70 cents at $12.18.
From FT Alphaville's Markets Live post:
Participants in this session were: Paul Murphy and Bryce Elder
PM Ok! Welcome to ML
PM Markets Live
PM This feels like an important session
PM Not that all our ML sessions are not important
PM But this one, especially so
PM We’re gonna save Deutsche Bank
PM Yes, really
PM Emoticon Deutsche Bank
PM Buy it now
BE Steady.
PM Don’t hesitate
PM Deep deep value
PM Deep value hiding in plain sight
PM This is Deutsche
PM And Bryce has a plan
PM The Elder Plan
PM Gonna save what should be Europe’s biggest and strongest financial institution
PM Let me get a couple of charts up
PM Here’s the stock price near term
BE
PM And longer term
BE
PM The Elder plan, when enacted will prob see the price double
PM mI say when not if
BE Hell’s teeth, Murph. You might be building this up a wee bit much.
...MUCH MORE

Questions America Wants Answered: "Does Forward Guidance Work?" - New York Fed

From the Federal Reserve Bank of New York's Liberty Street Economics blog:
In recent months, there have been some high-profile assessments of how far the Federal Reserve has come in terms of communicating about monetary policy since its “secrets of the temple” days. While observers say the transition to greater transparency “still seems to be a work in progress,” they note the range of steps the Fed has taken over the years to shed light on its strategy, including issuing statements to announce and explain policy changes following Federal Open Market Committee (FOMC) meetings, post-meeting press conferences and minutes, FOMC-member speeches and testimony, and “forward guidance” in all its variants.

The evolution to openness stems from a theoretical argument that central banks can enhance the effectiveness of monetary policy by projecting a path for the federal funds rate and then clearly communicating how changes in the economic outlook might alter it. That sets up an expectations dynamic where households and businesses can “count on” the Fed’s responses to new developments. In a climate of easing, markets would react by driving down long-term interest rates on the expectation that the Fed will lower the policy rate, thus doing the “heavy lifting” to bolster the economy.

Several posts on Liberty Street Economics take note of the tools and approaches that economists use to measure the potential and effectiveness of forward guidance. For example, Richard Crump, Stefano Eusepi, and Emanuel Moench take advantage of a real-world laboratory created by an FOMC meeting in August 2011 when policymakers notably altered guidance. (The post-meeting FOMC statement shifted from saying economic conditions warranted an exceptionally low policy rate “for an extended period” to a more specific date “at least through mid-2013.”) Their analysis exploits the timing of surveys in a narrow window just before and after the meeting to show, among other things, that professional forecasters changed their expectations for monetary policy “considerably” and in a manner consistent with the language in the FOMC statement.

In another post, the same authors examined what happened to both market- and survey-based measures of the path of future interest rates in the wake of a June 2013 FOMC meeting. Interestingly, financial market measures (for example, the two-year Treasury yield and a key forward rate) shot up just after the meeting, while professional forecasters’ expectations remained steady. Our bloggers say forecasters “did not interpret Fed communication around the FOMC meeting as signaling a change” in the likely path for the federal funds rate (FFR). Instead, the behavior of rates was attributable to rising term premia, a measure of interest rate risk receiving heightened attention in research, policy discussions, and central bank communications....MORE

Hurricane Matthew Rapidly Intensifies

Jamaica and Cuba could get walloped by a Cat. 3.
From the Orlando Sentinel:

Hurricane Matthew gaining strength as Category 2 storm
Hurricane Matthew rapidly strengthened overnight into a Category 2 storm and forecasters say it could become a major hurricane before this weekend.

An Air Force Reserve Hurricane Hunter plane flew into the storm early this morning and found 100 mph winds, according to the National Hurricane Center in Miami. As of 8 a.m., the winds had increased to 105 mph.

Matthew is expected to continue strengthening today, while slowing down over the warm Caribbean Sea and forecasters said it could become a major hurricane soon. Latest predictions show it having at least 115 mph winds within 24 hours.

No warnings have been issued and forecasters say it's still too soon to know what impact Matthew could have on Florida. The storm's exact path remains fairly uncertain, but latest models show it staying off the east coast.

Matthew has been heading west at 14 mph, but is expected to turn to the north sometime this weekend, according to the Hurricane Center.

Forecasters say they should have a better idea of what the impact to Florida could be once it turns....MORE
And from Wunderblog, the cone of uncertainty:

Hurricane Matthew

"AM markets: grain markets cower as key US report looms"

Today's reports and next month's WASDE are the last reports before the Northern Hemisphere harvests are in so we're getting ready to turn our attention to natural gas again.
'And the seasons they go round and round...'

Last Chg
Corn 326-6-2-4
Soybeans 949-2-1-0
Wheat 397-2-1-6

From Agrimoney:
So will it or won't it?

That is, will the US Department of Agriculture's quarterly report on domestic grain inventories (as of the start of this month) prove a boulder or a pebble when it plops later in the waters of global grain markets at 17:00 UK time (11:00 Chicago time)?
"Historically the stocks reports result in some large price movements," said Joe Lardy at CHS Hedging.
However, Benson Quinn Commodities raised doubts about whether the data will produce such a reaction this time.
"The corn and bean stocks have already been traded," the broker said, meaning that the data has already been factored into prices.
"So I don't expect much surprise there, with market moving on and trading record production potential and increasing US stocks outlook."
Market forecasts
Still, any market reaction depends on exactly what numbers that investors have factored into prices.
For soybeans, traders forecast a figure of 201m bushels, 6m bushels higher than the USDA's current estimate, with corn inventories seen coming in at 1.754bn bushels, some 38m bushels higher than the existing estimate.
"Analysts are largely expecting US corn stocks will be revised higher due to lower feed use," said Tobin Gorey at Commonwealth Bank of Australia.
 Any reaction will also depend on whether any addition to/subtraction from the existing stocks number would really matter.
Current USDA inventory numbers for both corn and soybean numbers are on the high side, compared with stocks seen earlier in the decade, implying that it would take a bigger divergence from expectations to cause a big price reaction.
Harvest progress vs yield
Still, there was a certain amount of trepidation around in grain markets in early deals, with December corn futures for December standing flat at $3.29 ¼ a bushel as of 09:30 UK time (03:30 Chicago time)....MORE

Stephen Roach: "Desperate Central Bankers"

Project Syndicate:
Stephen S. Roach, former Chairman of Morgan Stanley Asia and the firm's chief economist, is a senior fellow at Yale University's Jackson Institute of Global Affairs and a senior lecturer at Yale's School of Management. He is the author of Unbalanced: The Codependency of America and China.
NEW HAVEN – The final day of the summer marked the start of yet another season of futile policymaking by two of the world’s major central banks – the US Federal Reserve and the Bank of Japan. The Fed did nothing, which is precisely the problem. And the alchemists at the BOJ unveiled yet another feeble unconventional policy gambit. 

Both the Fed and the BOJ are pursuing strategies that are woefully disconnected from the economies they have been entrusted to manage. Moreover, their latest actions reinforce a deepening commitment to an increasingly insidious transmission mechanism between monetary policy, financial markets, and asset-dependent economies. This approach led to the meltdown of 2008-2009, and it could well sow the seeds of another crisis in the years ahead. 

Lost in the debate over the efficacy of the new and powerful tools that central bankers have added to their arsenal is the harsh reality of anemic economic growth. Japan is an obvious case in point. Stuck in what has been essentially a 1% growth trajectory for the last quarter-century, its economy has failed to respond to repeated efforts at extraordinary monetary stimulus. 

Whatever the acronym – first, ZIRP (the zero interest-rate policy of the late 1990s), then QQE (the qualitative and quantitative easing launched by BOJ Governor Haruhiko Kuroda in 2013), and now NIRP (the recent move to a negative interest-rate policy) – the BOJ has over-promised and under-delivered. In fact, with Japan’s real annual GDP growth slipping to 0.6% since Shinzo Abe was elected Prime Minister in late 2012 – one-third slower than the sluggish 0.9% average annual rate over the preceding 22 lost years (1991 to 2012) – the so-called maximum stimulus of “Abenomics” has been an abject failure. 

The Fed hasn’t fared much better. Real GDP growth in the US has averaged only 2.1% in the 28 quarters since the Great Recession ended in the third quarter of 2009 – barely half the 4% average pace in comparable periods of earlier upturns. 

As in Japan, America’s subpar recovery has been largely unresponsive to the Fed’s aggressive strain of unconventional stimulus – zero interest rates, three doses of balance-sheet expansion (QE1, QE2, and QE3), and a yield curve twist operation that seems to be the antecedent of the BOJ’s latest move. (The BOJ has just announced that it is targeting zero interest rates for ten-year Japanese government bonds.) 

Notwithstanding the persistent growth shortfall, central bankers remain steadfast that their approach is working, by delivering what they call “mandate-compliant” outcomes. The Fed points to the sharp reduction of the US unemployment rate – from 10% in October 2009 to 4.9% today – as prima facie evidence of an economy that is nearing one of the targets of the Fed’s so-called dual mandate. 

But when seemingly solid employment growth is juxtaposed against weak output, the story unravels, revealing a major productivity slowdown that raises serious questions about America’s long-term growth potential and an eventual buildup of cost and inflationary pressures. The Fed can’t be faulted for trying, argue the counter-factualists who insist that only unconventional monetary policies stood between the Great Recession and another Great Depression. That, however, is more an assertion than a verifiable conclusion. 

While policy traction has been notably absent in the real economies of both Japan and the US, asset markets are a different story. Equities and bonds have soared on the back of monetary policies that have led to rock-bottom interest rates and massive liquidity injections. 

The new unconventional monetary policies in both countries are obviously missing the disconnect between asset markets and real economic activity. This reflects the aftermath of wrenching balance-sheet recessions, in which aggregate demand, artificially propped up by asset-price bubbles, collapsed when the bubbles burst, leading to chronic impairment of overleveraged, asset-dependent consumers (America) and businesses (Japan). Under such circumstances, the lack of response at the zero bound of policy interest rates is hardly surprising. In fact, it is strikingly reminiscent of the so-called liquidity trap of the 1930s, when central banks were also “pushing on a string.” 

What is particularly disconcerting is that central bankers remain largely in denial in the face of this painful reality check. As the BOJ’s latest actions indicate, the penchant for financial engineering remains unabated. And as the Fed has shown once again, the ever-elusive normalization of policy interest rates continues to be put off for yet another day....MORE

Thursday, September 29, 2016

"The Challenges And Triumphs Of Expanding A Family-Owned Winery"

Tell me about it.*
From Forbes:
Much of the discussion about Napa Valley tends to focus on bigger producers—or, at the very least, the ones with the greatest name recognition. But in a region as important and unexpectedly diverse as Napa, there are of course countless smaller producers whose wines deserve to be tasted more broadly, and whose stories reveal a very different side to the reputation and stereotypes of one of the world’s most famous, and important, wine-growing regions. 
Taylor Family Vineyards embodies not just the current state of winemaking in Napa Valley, but the region’s history, too. In that way, as well as the various challenges and triumphs they are currently experiencing, the Taylor story sheds an eye-opening light on a region that, for all its renown and glamour, is often not all that well understood beyond its glossy surface. 
I first became aware of Taylor Family Vineyards nearly six years ago, when I received a mixed case of samples from Stags Leap District in preparation for a story I was writing on the AVA (American Viticultural Area). Stags Leap is among the most well-known of the AVAs within Napa Valley, and producers like Shafer Vineyards, Cliff Lede, Stag’s Leap Wine Cellars, Stags’ Leap Winery, Pine Ridge, Chimney Rock, and more have garnered high praise for decades. And while I was impressed with the range and high quality of all the wines in that sample case, Taylor Family Vineyards was one of the standouts–deeply expressive, soulful, and with lots of potential for aging in the cellar. Since then, I have followed their evolution with interest, and have been drinking their wines with more regularity than I would have expected. (My father, a wine collector, joined Taylor’s mailing list after tasting the remnant of my sample bottle back in 2010, and their Cabernet Sauvignons and Chardonnays are often our wine of choice to toast family birthdays, anniversaries, and other notable occasions.)...MORE
*Just kidding, despite making installment payments that could have bought France, I don't own a vineyard.
I just wanted a chance to reprise one of the all-time greatest retweet comments, this one from former chess World Champion Garry Kasparov in response to The Onion: