From All-Star Charts:
One of the scariest looking charts in the world today has to be Silver. The other popular precious metal, Gold, is looking pretty terrible itself, as we mentioned on Wednesday. But it doesn’t get worse than Silver. I first brought up this bearish development a month ago, but since then the scenario has actually worsened. Let’s get right into it.
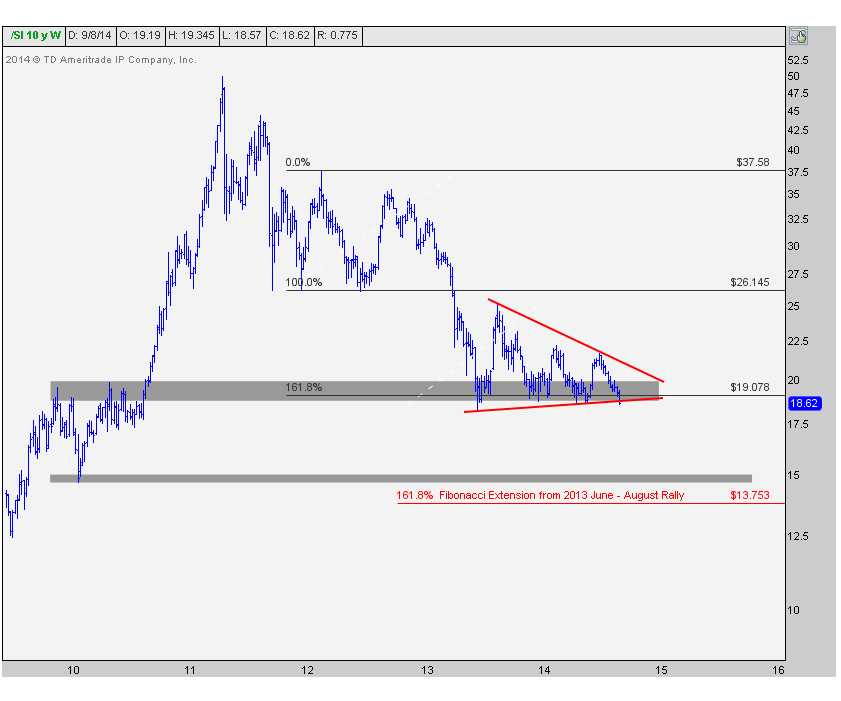
Here is a weekly bar chart of Silver going back to the rally that got going towards the end of 2010 that took silver close to $50/oz. There are a few things that I want to point out here. First of all, notice how many times Silver has tested this support just below $19. This area is key because not only was this former resistance in 2010 but it also represents the 161.8% Fibonacci extension from the early 2012 counter trend rally, which was the biggest one before the eventual breakdown last year....MORE

Most active December futures $18.675 last
Earlier:
Gold, Silver Continue Fearless Decline
See also:
Silver Bounces at Support For the Fourth Time In 14 Months
An Argument For $13 Silver and $1100 Gold