From Climate.gov:
Details on the June 2014 ENSO discussion
Thursday, June 5, 2014
Today, the Climate Prediction Center (CPC) released the June ENSO Diagnostic Discussion. Chances that an El Niño will occur by summer are above 70%, and reach 80% by the fall. Sea-surface temperature anomalies increased across all the Niño index regions in May; the latest weekly value of the Niño3.4 index is now above +0.5°C. Tropical rainfall across Indonesia and the Pacific remain close to average, but forecasters are confident that the atmosphere will begin to respond to the ocean and El Niño will develop, likely in the next few months.
Recently, there’s been a lot of speculation about how strong this El Niño will be, especially considering the strong westerly wind bursts in late winter, and the large subsurface temperatures in early spring. The subsurface temperatures in March, which was a record for the month going back to 1979, inspired comparisons to the early stages of the 1997/98 El Niño, the largest on record (ONI maximum of 2.4). That event also developed in the spring, like this one. However, right now, forecasters are not favoring a strong event (while not at all ruling it out) and believe a moderate event (ONI 1.0 - 1.5) is slightly more likely, sometime during the fall/winter. So what’s going on?
First, the subsurface temperatures have tapered off a bit recently (Figure 1). While still substantially above normal, the average of the upper-ocean (300m to surface) temperatures in the tropical Pacific has decreased over the past two months. SSTs tend to lag this measurement, often by a few months and with lesser intensity.
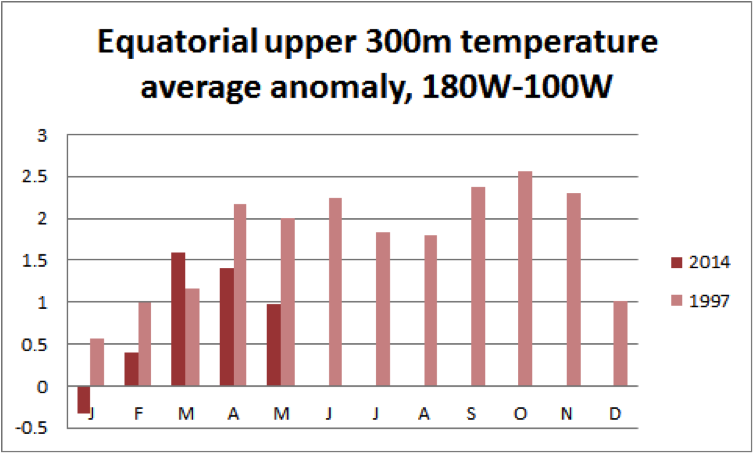
Figure 1: Equatorial ocean upper 300-meter temperature average anomaly during January-December of 1997 and 2014.
The difference between 1997 and 2014 are also illustrated by the May cross-sections of temperature anomaly along the equator (Figure 2). If you’re interested, you can check out the history of ocean temperature anomalies and compare other El Niño events, such as 2002/03 or 2009/10, at a new CPC site.
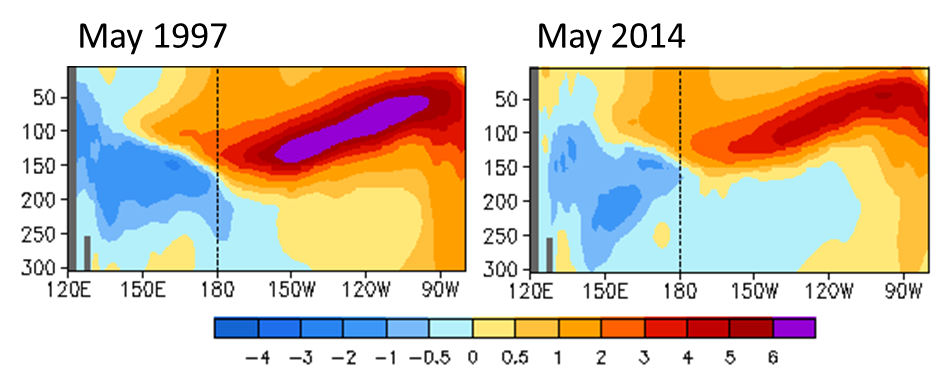
Figure 2. Subsurface temperature (degrees C) cross-sections from May 1997 (left) and 2014 (right). The figures are showing the average of several different subsurface temperature datasets. Maps based on data from the Real Time Multiple Ocean Reanalysis Intercomparison website.
Another factor the forecasters are considering is the model guidance. Most climate models are predicting a weak-to-moderate event, with dynamical models slightly favoring a moderate event and statistical models favoring a weaker event. The ensemble mean of NCEP’s Climate Forecast System, CFSv2 (Figure 3, black dashed line) has been fairly consistent in forecasting Niño3.4 anomalies in the range of 1.0-1.5°C, but, as you can see from the individual model runs (blue, red, and gray lines), there is an envelope of possible values from 0°C to slightly above 2.0°C.......MUCH MORE
Also at Climate.gov:
Welcome to the ENSO Blog: We’re diving into the blogging world!
What is the El Niño–Southern Oscillation (ENSO) in a nutshell?
Impacts of El Niño and La Niña on the hurricane season