Here's the latest from Dragonfly Capital:
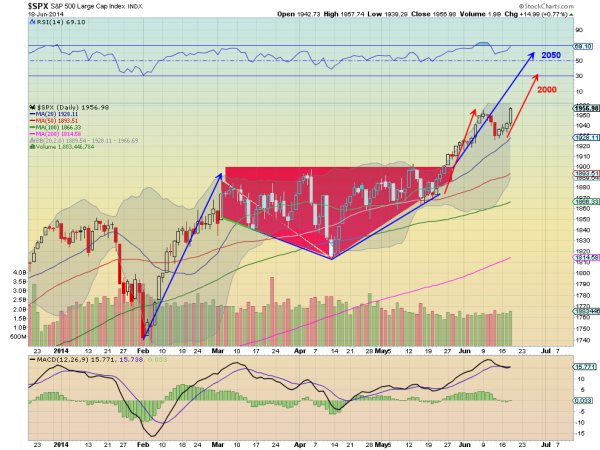
One simple perspective suggests that the S&P 500 may have another 100 points in it. Take a look at the chart below.
This chart looks at the price action in the S&P 500 ($SPX) this year. There are three areas to note technically. The first is the run from the February low the beginning of consolidation in March. This was about 150 points. The second is the unusually shaped consolidation area in red that held the Index 3 months. The third is the move higher out of that consolidation. Using a simple Measured Move, a move equal to the move into consolidation (blue arrow) to measure the potential move out of it, gives a target of 2050. The second measure looks at the red arrows. Using the same technique the next stop could be at 2000 on this move after the minor pullback last week. One view and one perspective. But this Index looks like it wants higher.The S&P 500 closed at 1953 on Friday so he's looking for around 5%.
I'm tellin ya, it's a bull market.

