From the Money Illusion:
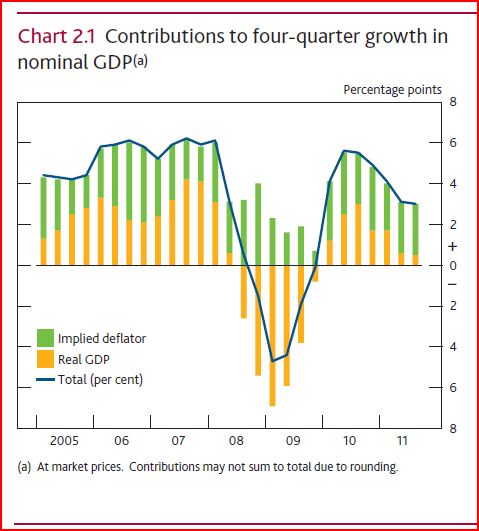
Commenter 123 sent me the February BOE inflation report, with this very interesting graph:56 page PDF, nice graphics.
.
I suspect the NGDP instability contributed to fluctuations in RGDP growth, but it also looks like Britain has serious supply-side problems. Remember that the BOE inflation target is 2%.
I have a question for my Keynesian readers. Again and again the report refers to changes in real output as changes in “demand.” I’m pretty sure that’s Keynesian terminology, but it makes absolutely no sense to me. Here’s an example:
The pace of four-quarter global demand growth slowed in 2011. But, within that, there was some divergence in growth rates across different regions. And business surveys suggest that activity may have picked up a little in some countries at the beginning of this year (Chart 2.8). Against the backdrop of subdued global demand growth, world trade rose only modestly in the year to November 2011.Chart 2.8 shows output trends, not AD. They also refer to real domestic final sales (C+I+G) as “domestic demand.” I find this terminology bizarre, but maybe I’m missing something. For instance, suppose the AD curve was stable, and the AS curve shifted to the right, producing real economic growth. The BOE would apparently call that real growth an increase in “demand” even though it was caused by an increase in supply. It seems to me that causes needless confusion, and is likely to lead one to overemphasize the importance of demand shocks in driving RGDP growth....MORE
