Grantham's problem, shared by moi, is that just because one sees (or thinks they see) an anomaly, there really isn't any reason to believe the market will act on it in the time frame that you presume it might.
Way back in 2010 we were posting "Grantham’s ‘Horrifically Early’ Calls Challenge GMO".
This piece is also an example. It has been sitting in the link-vault since August 31, 2022.
From GMO:
Executive Summary
Only a few market events in an investor’s career really matter, and among the most important of all are superbubbles. 1 These superbubbles are events unlike any others: while there are only a few in history for investors to study, they have clear features in common.
One of those features is the bear market rally after the initial derating stage of the decline but before the economy has clearly begun to deteriorate, as it always has when superbubbles burst. This in all three previous cases recovered over half the market’s initial losses, luring unwary investors back just in time for the market to turn down again, only more viciously, and the economy to weaken. This summer’s rally has so far perfectly fit the pattern.
The U.S. stock market remains very expensive and an increase in inflation like the one this year has always hurt multiples, although more slowly than normal this time. But now the fundamentals have also started to deteriorate enormously and surprisingly: between COVID in China, war in Europe, food and energy crises, record fiscal tightening, and more, the outlook is far grimmer than could have been foreseen in January. Longer term, a broad and permanent food and resource shortage is threatening, all made worse by accelerating climate damage.
The current superbubble features an unprecedentedly dangerous mix of cross-asset overvaluation (with bonds, housing, and stocks all critically overpriced and now rapidly losing momentum), commodity shock, and Fed hawkishness. Each cycle is different and unique – but every historical parallel suggests that the worst is yet to come.
The Times that Really Matter for Investors
Most of the time (85% or thereabouts) markets behave quite normally. In these periods, investors (managers, clients, and individuals) are happy enough, but alas these periods do not truly matter. It is only the other 15% of the time that matters, when investors get carried away and become irrational. Mostly (about 12% of the time 2 ), this irrationality is excessive optimism, when you see meme stock squeezes and IPO frenzies, such as in the last 2 years; and just now and then (about 3% of the time), investors panic and sell regardless of value, as they did at 666 on the S&P in 2009 and with many stocks trading at a 2.5 P/E in 1974. These times of euphoria and panic are the most important for portfolios and the most dangerous for careers. (Keynes’ famous Chapter 12 would suggest that when confronted with a bubble, running off the cliff with company is the safest strategy for managers, whose business imperative, after all, is to be a permabull, where the real money can be made. This is a strategy adopted reasonably enough by almost everyone. 3 )
This 15% is very different from ordinary bull and bear markets. Averaging ordinary bull and bear markets with this handful of outliers dilutes the data and produces misleading signals. My strong suggestion is to treat the superbubbles – 2.5 to 3 sigma events – as special, collectively unique occasions. It is as if there is a phase change in investor behavior. After a long economic upswing and a long bull market, when the financial and economic systems look nearly perfect, especially with low inflation and high profit margins, as does the friendliness of the authorities, especially toward cheap leverage, there gets to be a flashpoint, like that summer evening when every last flying ant takes off simultaneously. This effect luckily creates measurable events in the market. So you can see the explosion of confidence and speculation and crazy wishful thinking regardless of value however you wish to define it. And outcomes from this unique group of superbubbles (just three in modern times in the U.S. before this current one) are indeed special: the much discussed (by us) divergence between conservative and speculative stocks; the rapid bear market rallies discussed later here; the rapid onset of recession (3 out of 3 incidents to date, with 1 mild – 2000 – and the other 2 – 1929 and 1972 – severe); and finally, the much increased probabilities of further unexpected financial and economic accidents.
We’ve been in such a period, a true superbubble, for a little while now. And the first thing to remember here is that these superbubbles, as well as ordinary 2 sigma bubbles, have always – in developed equity markets – broken back to trend. The higher they go, therefore, the further they have to fall.
The Stages of a Superbubble
My theory is that the breaking of these superbubbles takes multiple stages. First, the bubble forms; second, a setback occurs, as it just did in the first half of this year, when some wrinkle in the economic or political environment causes investors to realize that perfection will, after all, not last forever, and valuations take a half-step back. Then there is what we have just seen – the bear market rally. Fourth and finally, fundamentals deteriorate and the market declines to a low.
Let’s return to where we are in this process today. Bear market rallies in superbubbles are easier and faster than any other rallies. Investors surmise, this stock sold for $100 6 months ago, so now at $50, or $60, or $70, it must be cheap. Outside of the late stage of a superbubble, new highs are slow and nervous as investors realize that no one has ever bought this stock at this price before: so it is four steps forward, three steps back, gingerly exploring terra incognita. Bear market rallies are the opposite: it sold at $100 before, maybe it could sell at $100 again.
The proof of the pudding is the speed and scale of these bear market rallies.
- From the November low in 1929 to the April 1930 high, the market rallied 46% – a 55% recovery of the loss from the peak.
- In 1973, the summer rally after the initial decline recovered 59% of the S&P 500's total loss from the high.
- In 2000, the NASDAQ (which had been the main event of the tech bubble) recovered 60% of its initial losses in just 2 months.
- In 2022, at the intraday peak on August 16th, the S&P had made back 58% of its losses since its June low. Thus we could say the current event, so far, is looking eerily similar to these other historic superbubbles.
Fundamentals Threaten to Fall Apart
Economic data inevitably lags major turning points in the economy. To make matters worse, at the turn of events like 2000 and 2007, data series like corporate profits and employment can subsequently be massively revised downwards. It is during this lag that the bear market rally typically occurs.
Why are the historic superbubbles always followed by major economic setbacks? Perhaps because they occurred after a very extended build-up of market and economic forces – with a major surge of optimism thrown in at the end. At the peak, the economy always looks near perfect: full employment, strong GDP, no inflation, record margins. This was the case in 1929, 1972, 1999, and in Japan (the most important non-U.S. superbubble). The ageing cycle and temporary near perfection of fundamentals leave economic and financial data with only one way to go.
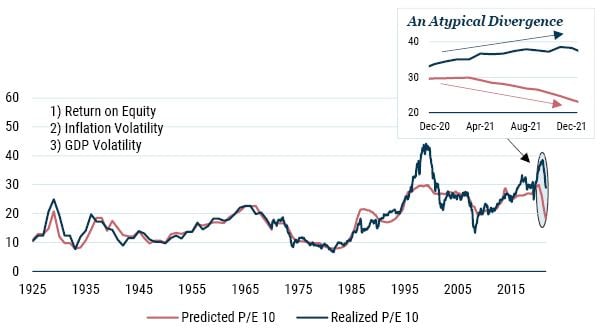
Our “Explaining P/E” 4 exhibit says something similar. The first leg down in today’s superbubble was “explained” by rising inflation, which has been the main driver of historical valuations, after an unprecedented lag during the second half of 2021. (Although the most speculative stocks were hit fast and hard from the beginning of 2021.) If anything, the question for us at GMO is why such a historic inflation surge in 2021 did not immediately hit broad market P/Es more substantially: new players in the stock market unfamiliar with inflation? Excessive belief in the Fed’s ability to support markets and hence too much faith that inflation would be transitory? The next leg for the model is likely to be driven by falling margins. Our best guess is that the level of explained P/E will fall toward 15x, compared to the current level of explained P/E of just under 20x, while the actual P/E just rose from 30x to 34x in mid-August in what was probably a bear market rally. (Of course, if the model is indeed driven by falling margins in the near future, then the E will fall as well as the P/E. As you can see, this would imply a substantially lower market than even we have suggested!)
GMO “Explaining P/E” Model
As of 7/20/2022 | Source: GMO
My papers, “Waiting for the Last Dance” and “Let The Wild Rumpus Begin,” made a simple point: in the U.S., the three near perfect markets with crazy investor behavior and 2.5+ sigma overvaluation have always been followed by big market declines of 50%. The papers said nothing about fundamentals except to expect some deterioration. Now here we are, having experienced the first leg down of the bubble bursting and a substantial bear market rally, and we find the fundamentals are far worse than expected.
The whole world is now fixated on the growth-reducing implications of inflation, rates, and wartime issues such as the energy squeeze. In addition, there are several less obvious short-term problems. Meanwhile, the long-term problems of demographics, resources, and climate are only getting worse and now are beginning to bite even in the short run.
Near-Term Problems
- The food/energy/fertilizer problems, exacerbated by the war in Ukraine, are even worse in the emerging world (especially Africa) than the European energy problems we have heard about. Russia and Belarus account for 40% of global exports of potash, a key fertilizer, driving wheat/corn/soybean prices to records earlier this year. Increased food and energy prices are causing acute trade imbalances and civil disorder in the most vulnerable countries, as seen for example in the extremely rapid virtual collapse of the Sri Lankan economy. The energy shock is now all but guaranteed to tip Europe into recession; while the U.S. market has a long history of ignoring foreign problems and interactions, global growth is assuredly coming down....
....MUCH MORE
One example of where Mr. Grantham isn't just early but wrong is seen in 2012's:
Vaclav Smil Takes on Jeremy Grantham Over Peak Fertilizer
We posted the whole of Mr. Grantham's Nov. 15 Nature piece for fear it would go behind Nature's paywall.
To date it hasn't. Also to date I haven't come through on my assurance in Nov. 24ths "Jeremy Grantham "On the Road to Zero Growth" as His Co-head of Asset Allocation Does the Full Monty". I promise I'll get to it.
We have almost as many posts on Professor Smil as we do on Mr. Grantham. This is the first time they've been together. I feel very uncomfortable being on the opposite side of Mr. G on just about anything but in this case Smil is right....