He says no but he was also pushing investments in China* that are now down 50 - 60%.
He's such an odd duck. I mean most multi-billionaires are odd ducks, it's sort of a prerequisite for the self-made or a condition of employment for inheritors but even in this cohort he sticks out.
I on the other hand think things are bubbly but will get even more bubblicious as long as "the grass shall grow and excess liquidity flow." (apologies to all the U.S. - indigenous treaty writers of a couple centuries ago)
From Mr. Dalio's LinkedIn page, February 29:
What the latest readings from my bubble gauge say about the market.
As you know, I like to convert my intuitive thinking into indicators that I write down as decision rules (principles) that can be back tested and automated to put together with other principles and bets created the same way to make up a portfolio of alpha bets. I have one of these for bubbles. Having been through many bubbles over my 50+ years of investing, about 10 years ago I described what in my mind makes a bubble, and I use that to identify them in markets—all markets, not just stocks.
I define a bubble market as one that has a combination of the following in high degrees:
- High prices relative to traditional measures of value (e.g., by taking the present value of their cash flows for the duration of the asset and comparing it with their interest rates).
- Unsustainable conditions (e.g., extrapolating past revenue and earnings growth rates late in the cycle when capacity limits mean that that growth can’t be sustained).
- Many new and naïve buyers who were attracted in because the market has gone up a lot, so it’s perceived as a hot market.
- Broad bullish sentiment.
- A high percentage of purchases being financed by debt.
- A lot of forward and speculative purchases made to bet on price gains (e.g., inventories that are more than needed, contracted forward purchases, etc.).
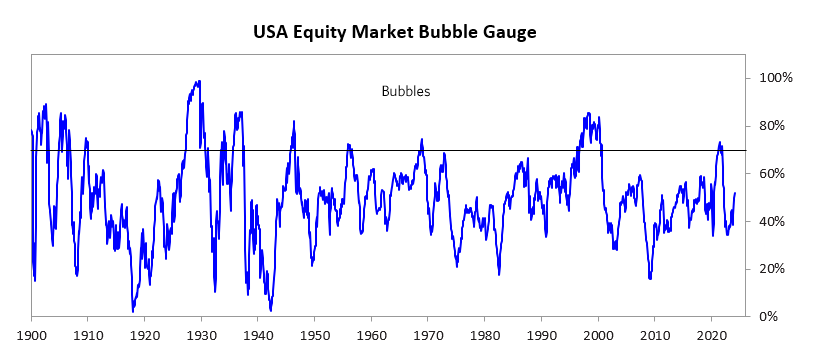
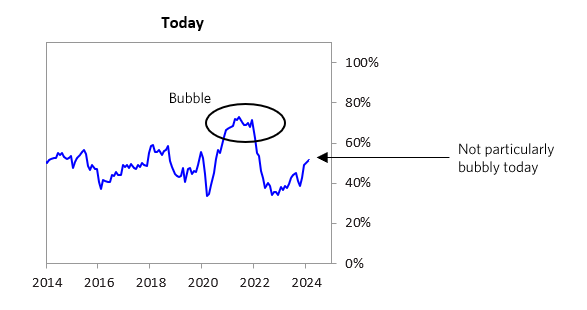
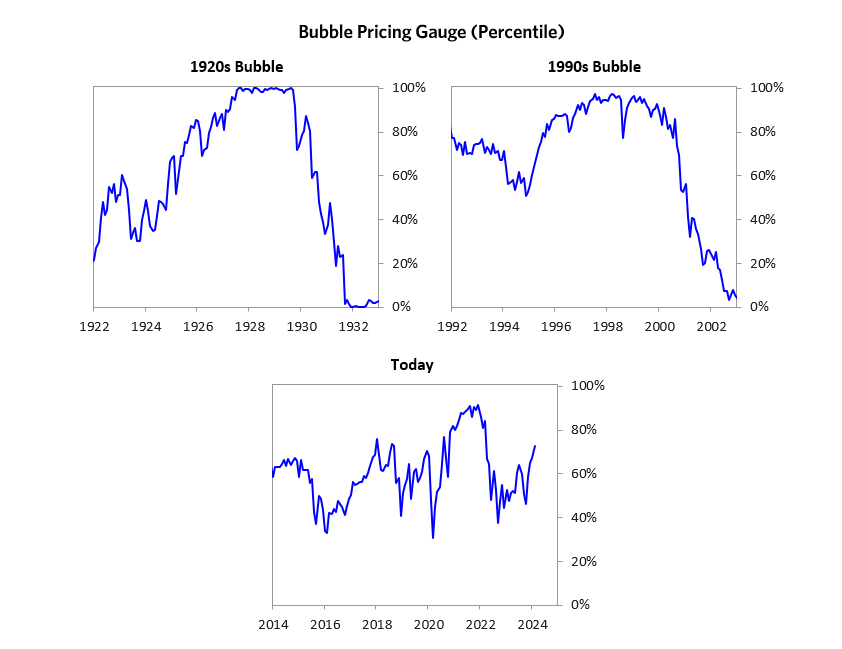
I apply these criteria to all markets to see if they’re in bubbles. When I look at the US stock market using these criteria (see the chart below), it—and even some of the parts that have rallied the most and gotten media attention—doesn’t look very bubbly. The market as a whole is in mid-range (52nd percentile). As shown in the charts, these levels are not consistent with past bubbles.

The “Magnificent 7” has driven a meaningful share of the gains in US equities over the past year. The market cap of the basket has increased by over 80% since January 2023, and these companies now constitute over 25% of the S&P 500 market cap. The Mag-7 is measured to be a bit frothy but not in a full-on bubble. Valuations are slightly expensive given current and projected earnings, sentiment is bullish but doesn’t look excessively so, and we do not see excessive leverage or a flood of new and naïve buyers. That said, one could still imagine a significant correction in these names if generative AI does not live up to the priced-in impact.
In the remainder of this post, I’ll walk through each of the pieces of the bubble gauge for the US stock market as a whole and show you how recent conditions compare to historical bubbles. While I won’t show you exactly how this indicator is constructed, because that is proprietary, I will show you some of the sub-aggregate readings and some indicators.
Each of these six influences is measured using a number of stats that are combined into gauges. The table below shows the current readings of each of these gauges for the US equity market. It shows how the conditions stack up today for US equities in relation to past times. Our readings suggest that, while equities may have rallied meaningfully, we’re unlikely to be in a bubble.
For the Mag-7, some of our readings look frothy, but we do not see bubbly conditions in aggregate. We have somewhat lower confidence in this determination because we don’t have a high-confidence read on how impactful generative AI will turn out to be, and that is a significant influence on the expected cash flows of many of these companies.

The next few sections go through each of these sub-gauges in more detail.
1. How High Are Prices Relative to Traditional Measures?
The current read on this price gauge for US equities is around the 73rd percentile.
....MUCH MORELooking at the Mag-7, we are reading Alphabet and Meta as somewhat cheap, and Tesla as somewhat expensive. We’d call the group in aggregate fairly priced. This value read is partly based on analyst expectations for growth, so we are assuming that analysts are making reasonable predictions for growth driven by generative AI. This is an area where we have lower confidence because there is so much inherent uncertainty and because it is not our area of expertise.
2. Are Prices Discounting Unsustainable Conditions?
This measure calculates the earnings growth rate that is required to produce equity returns in excess of bond returns. This is derived by looking at individual securities and adding up their readings. Currently, this indicator is just around the 67th percentile for the aggregate market—more elevated than some of our other readings. The earnings growth discounted in stocks is still a bit high....
*Some prior posts:
"Is Dalio's Bridgewater A Fraud? Here Are The Troubling Questions Posed By Jim Grant"—UPDATED II
Bridgewater, World’s Largest Hedge Fund, Is Building An Algorithmic Model Of Ray Dalio's Brain
Frederick Taylor and Ray Dalio's Brain: "Working for an Algorithm Might Be an Improvement"
Bridgewater's Ray Dalio Really Didn't Like The Wall Street Journal Story on His Brain (he's also against fake news)
"Why Ray Dalio is wrong about China"
Speaking of China, Bridgewater's Ray Dalio Has Some Thoughts
"Western Greed Fuels China's Domination"
It's good to name names. Unfortunately Dalio, Dimon, Fink and Cook sounds like the law firm from hell.....