We will be referring back to this article as part of a deeper dive into Jamie Dimon and JP Morgan.
From Finance Training Course, April 19, 2014:
A Synthetic Credit Portfolio trader, Bruno Iksil, was given the title of the “London Whale” in the April 6, 2012 issue of the Wall Street Journal and Bloomberg. (Hurtado) This case study focuses on the reasons for that article and the series of derivative transactions (involving credit default swaps) which cost JPMorgan Chase & Co. more than $6.2 billion.
It is not a single event that brings about catastrophic loss. Just as investigative studies on historical air crashes reveal, financial loss events that are now part of business school case studies too, are usually the cumulative results of many contributing factors. Wrong decisions, poor choices, lapses in judgment, not understanding or accepting limitations, faulty controls and oversight, conflicting interests as well as external events beyond company control, all contribute to bringing about a calamitous news breaking event.
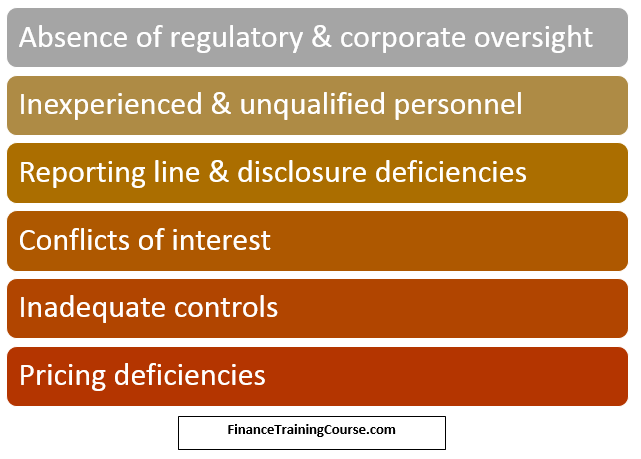
In the case of the JP Morgan Chase London Whale CIO synthetic credit portfolio (SCP) debacle, some of the contributing factors were:
Overview
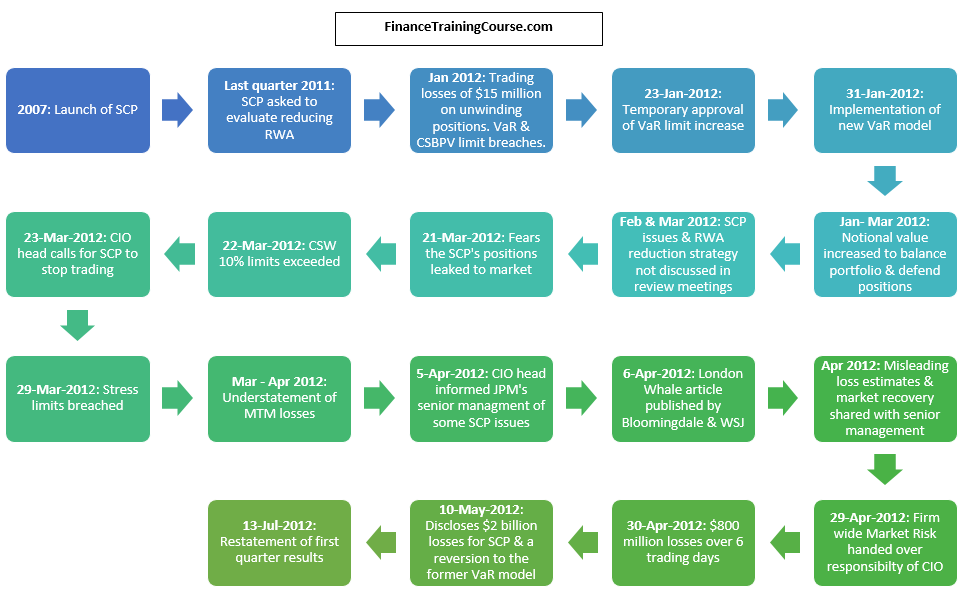
To briefly recap the London Whale debacle before moving to the contributing factors:JPM’s CIO was responsible for investing the excess cash of the bank. The main investment was in high quality income bearing securities such as whole loans, mortgage backed securities, corporate securities, sovereign securities, asset backed securities, etc. The synthetic credit portfolio (SCP) was constructed in 2007 in order to protect the bank against adverse credit scenarios such as widening credit spreads during the financial crisis.
The synthetic credit portfolio positions were based on standardized credit default swap (CDS) indices. The positions were the purchase and sale of protection against credit events of the corporate issuers tied to the basket of CDS included in the indices. If the protection was bought (short risk positions) the cash flows were as follows:
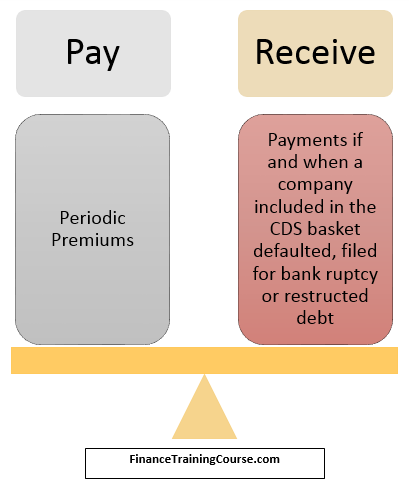
If the protection was sold (long risk positions) the opposite would be true – in exchange for receiving premiums, the CIO would have to pay protection if a credit event were to occur in the concerned index. Positions were in the different CDS indices & tranches (CDX, iTraxx; Investment grade and High Yield).
While the SCP performed well in 2009 netting the CIO $1 billion, the notional size of its synthetic portfolio increased significantly from $4 billion to $51 billion during 2011, in light of the European default crisis. In December 2011, following a more positive outlook for the economy, CIO was asked to reduce the exposure of SCP and the risk weighted assets of the CIO.
Given the loss estimate of $500 million for unwinding synthetic credit portfolio positions by selling them off due to current market conditions, loss of premium & execution costs, and following a chance win of $400 million on a speculative trade, the CIO instead opted to reduce RWA by implementing a hedging strategy using a portfolio of options, in line with the Comprehensive Risk Measure (CRM) of Basel 2.5, and a new VAR model to calculate the risk & limits.
The new model significantly reduced risk numbers, allowing the traders to implement the options portfolio strategy. However, the strategy did not work as expected, given that the market environment and correlation between positions were not in line with traders’ expectations, and instead resulted in trading losses that continued accumulating. CIO traders tried to defend their existing positions by further growing their portfolios with huge trades to support market prices. Given the illiquidity of the markets, however, the CIO became significant market movers in these securities, thus reducing their ability to exit the markets without being impacted negatively by it.
For the first quarter financial results, CIO traders had tried to downplay mark to market losses by setting marks that were at significant variance to the midpoints of dealer quotes in order to show a better than actual MTM picture on the books. This eventually led to a restatement of the first quarter earnings and refiling of financial results. Mark to market losses grew to $5.8 billion as of 30th June 2012.
Absence of regulatory and corporate oversight
The CIO was not a client facing unit of the bank. For this reason, it did not receive the same scrutiny as other portfolios would receive in terms of regulatory compliance and corporate oversight.There were no separate portfolio limits based on market values or asset type limits set for the synthetic credit portfolio (SCP) and there was no daily reporting that was specific for the SCP to senior management. In addition, Risk committee meetings were held infrequently and did not seem to have any specific charter or mandate and were rarely attended by other than CIO personnel.
Due to the lack of oversight CIO traders were able to engage in speculative and risky derivative trades which were not in line with the CIO’s traditional investment strategy of long term investments with credit derivatives for hedging purposes only.
Regulatory oversight too was lacking. The Office of the Comptroller of Currency did not follow up on previous concerns raised regarding the transparency of the CIO’s investment decisions. They also did not raise the alarm when the update to a new VaR model resulted in risk numbers that were 50% lower than prior numbers, being unaware that a new model was being used.
London Whale – Inexperienced and unqualified personnel – CIO CRO
Risk management specifically for the credit derivatives portfolio of the CIO unit does not appear to have been a priority until after the size of the synthetic credit portfolio had already become unwieldy in January 2012. The task force assigned by JP Morgan Chase Bank to investigate CIO Losses reported that the risks of the trading strategies were neither adequately analyzed nor questioned prior to their implementation.Prior to February 2012 the risk management function was overseen by Peter Weiland chief market risk officer who reported directly to the bank’s CRO, Barry Zubrow. Mr. Zubrow, as the JPM task force report admits, did not take adequate steps to strengthen the risk and control framework for the CIO, while Mr. Weiland did not have the necessary clout to withstand the pressures from the traders and CIO management. Further, the CIO Risk team was unstaffed and did not have proper direction.
In February 2012, after the SCP had already gotten out of hand, Irv Goldman was appointed as the CIO’s first CRO. For Mr. Goldman, this was his first risk management position in his career which mainly had a capital markets focus. He would not have had the necessary experience to adequately address the deteriorating risk position of SCP during the period February 2012 to May 2012 as he was still learning the ropes of his new position.
With respect to corporate governance, Mr. Goldman’s appointment is itself a matter of controversy considering his lack of risk management experience, his appointed by his brother in law, Zubrow, his contentious past, having been fired from a previous position at Cantor Fitzgerald for insider trading in 2007.
Quantitative analyst – VaR model for the synthetic credit portfolio
The head of the European Equity and Credit unit of the International Investments Office, Javier Martin-Artajo and his Relative Value Strategic Trading head, Bruno Iksil (the London Whale) came up with a strategy to hedge the existing portfolio with a portfolio of options on the credit indices, so as to reduce the losses as well as the associated RWA of the synthetic credit portfolio.However, at that time, the SCP was already in breach of the VaR limits set for the portfolio. The new strategy would further increase the size of the breach as the overall exposure of the portfolio would increase with its implementation.
A solution was to implement a new VaR model for setting VaR limits. The new model would also influence the amount of risk weighted assets that were being calculated for the CIO. The premise for implementing a new model was that the existing one was too conservative which lead to an overstatement of risk thus resulting in limit breaches. This new VaR model was researched and built by the CIO itself specifically by Patrick Hagan, a front office quant, who had never before built or implemented a VaR model.
While the model was built after a number of months of research, it had mathematical & operational flaws which were highlighted by the bank’s Model Risk and Development Office. There were a number of additional issues that came to light much later. These included:
- Manual updates required in EXCEL spreadsheets
- Lowered volatility for illiquid securities based on the assumption that prices for days on which trades did not occur would be the same as the price when last traded
- Coding errors in the calculation of hazard rates and correlation estimates
- Use of a wrong Uniform Rate option in the built in analytics suite instead of the Gaussian Copula model option required under Basel 2.5
The Model Risk and Development Office required that the model be automated and that illiquid positions receive increased monitoring.
However, instead of a truly independent review of the model by the model review group and the standard parallel run of the old and new model during a probationary review period, the new model was implemented under pressure & without resolving the issues highlighted in it. Further, the analytics suite that the model utilized remained untested as of the date of implementation. The new model produced results that were as much as 50% lower than the existing model which did not raise questions of its appropriateness or accuracy at that time.
....MUCH MORE