As always, the directionally challenged thank ZH for the arrow on the chart.
Two From ZeroHedge:
GDP Misses As US Economy Grows Only 2% In Q3, Weakest Growth Since Covid Struck
With the Atlanta Fed cutting its GDPNow estimate to just 0.2% yesterday...
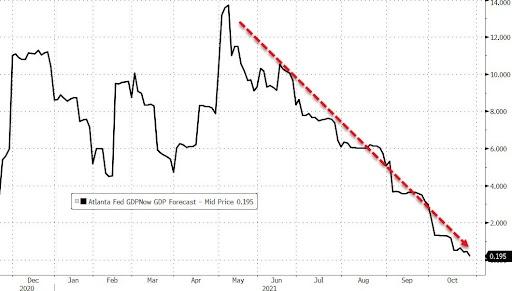
... there were big worries that today the BEA could reveal a shocker of a number, one far below the rapidly falling consensus estimate of 2.6%. Well, the Q3 GDP number just came out and it was bad, but not nearly as bad as it could have been: at 2.0%, it did indeed miss the 2.6% consensus by a lot but it could have been far worse.
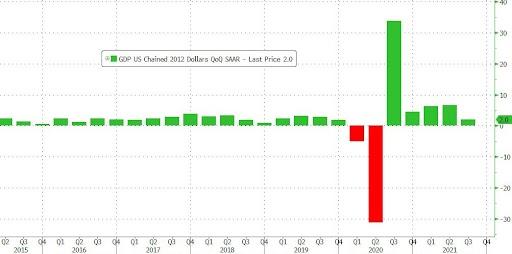
The third quarter GDP, which was the lowest since the Covid-collapse quarter of Q2 2020 when GDP crashed more than 30%, was a big drop from the 6.7% final Q2 GDP estimate, and the question now is how much further will subsequent revisions shrink the initial print and whether Q3 marks the lowpoint for US GDP or will Q4 be even worse.
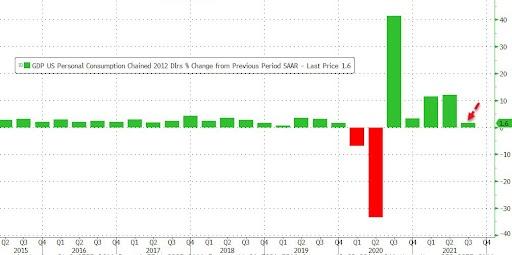
The deceleration in real Q3 GDP was led by a slowdown in consumer spending, which dropped to 1.6% from 12.0%, but was nonetheless a beat to expectations of an even worse, 0.9% print. Shortages, transportation bottlenecks, rising prices and the delta variant of the coronavirus weighed on both goods and services spending. Meanwhile, investment was a positive contribution, thanks mainly to businesses restocking depleted inventories. Trade was a negative, but has been a negative for some time. Government was a marginal factor, as it has been in recent quarters. It comes down to consumers not being able to buy as much as they want, effectively, thanks to supply-chain issues.
According to the BEA, the slowdown was due to a resurgence of COVID-19 cases resulted in new restrictions and delays in the reopening of establishments in some parts of the country. In the third quarter, government assistance payments in the form of forgivable loans to businesses, grants to state and local governments, and social benefits to households all decreased.
Looking at the GDP components, Q3 GDP reflected increases in inventory investment, consumer spending, state and local government spending, and business investment that were partly offset by decreases in housing investment, federal government spending, and exports. Imports, which are a subtraction in the calculation of GDP, increased.
- The increase in inventory investment primarily reflected increases in wholesale (led by nondurable goods industries) and retail(led by motor vehicle and parts dealers).
- The increase in consumer spending reflected an increase in services, led by “other” services (mostly international travel), transportation services, and health care. Consumer spending for goods decreased (led by motor vehicles and parts).
- The increase in state and local government spending primarily reflected an increase in compensation of state and local government employees (notably, education).
- The decrease in housing investment primarily reflected a decrease in housing improvements and new single-family structures.
- The decrease in federal government spending primarily reflected a decrease in nondefense spending on intermediate goods and services. In the third quarter, nondefense services decreased after the processing and administration of Paycheck Protection Programloan applications by banks on behalf of the federal government ended in the second quarter.
Quantifying these components we get the following picture:
- Personal spending contributed 1.09%, or about half, of the bottom line 2.01% number; this was down from 7.92% in Q2.
- Fixed investment subtracted 0.14% from the final print, a sharp drop from the 0.61% contribution in Q2; Nonresidential fixed investment, or spending on equipment, structures and intellectual property rose 1.8% in 3Q after rising 9.2% prior quarter
- The change in private inventories added a surprisingly large 2.07% to the bottom line number, a sharp improvement from -1.26% in Q2. Then again judging by the number of empty shelves and bogged down supply chains, this estimate looks just a "little" unrealistic.
- Net trade subtracted -1.15% from the bottom line GDP print, a deterioration from the -0.19% net exports print in Q2.
- Finally, government added 0.14% to the bottom line number, also an improvement to the -0.36% recorded last quarter....
....MUCH MORE
And:
US Yield Curve Inverts At Long-End As VaR Shock Spreads
Last night we noted the Czechs had the dubious honor of suffering the first yield curve inversion of this cycle...
The first inversion of many pic.twitter.com/wNPpbhcbM6
— zerohedge (@zerohedge) October 28, 2021
Then overnight saw the stress spread to Australia's bond market, as a massive move higher in 2Y Yields undoubtedly triggered chaos in risk control departments.
And that VaR shock is now spreading to the US, where for the first time ever the yield on the 30Y UST is below the yield on the 20Y UST...
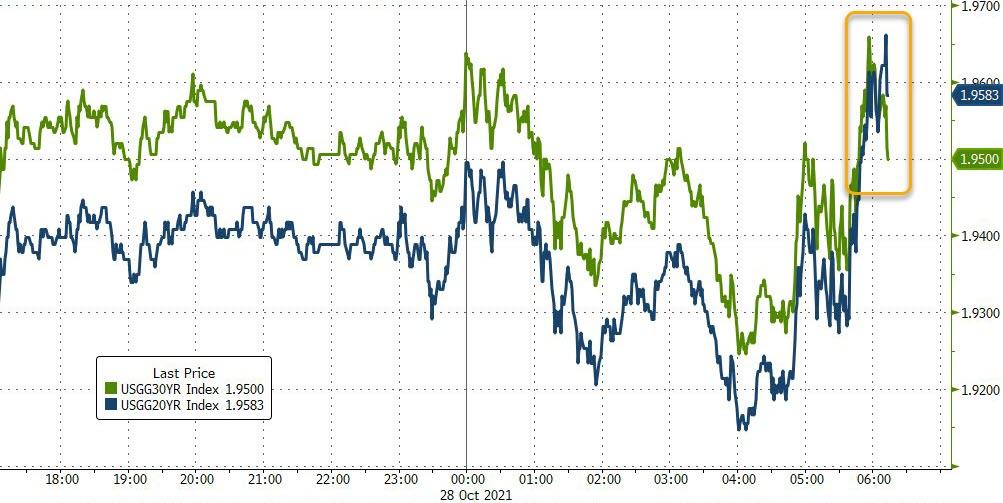
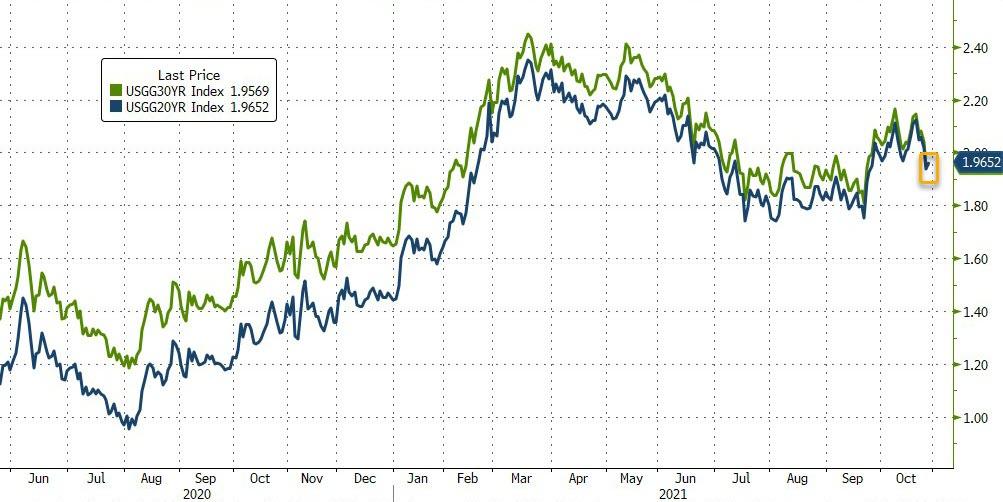
Source: Bloomberg
As Nomura's Charlie McElligott notes, this continues to be a disaster with trapped / bad positioning from clients, and Dealers largely unable to provide liquidity in light of event-risk (i.e. ECB) and VaR constraints, further exacerbating the stop-outs in both USD and EUR short upper left and steepeners seen seen recently....
....MORE