21, Jan 2019 8:19:29 PM)
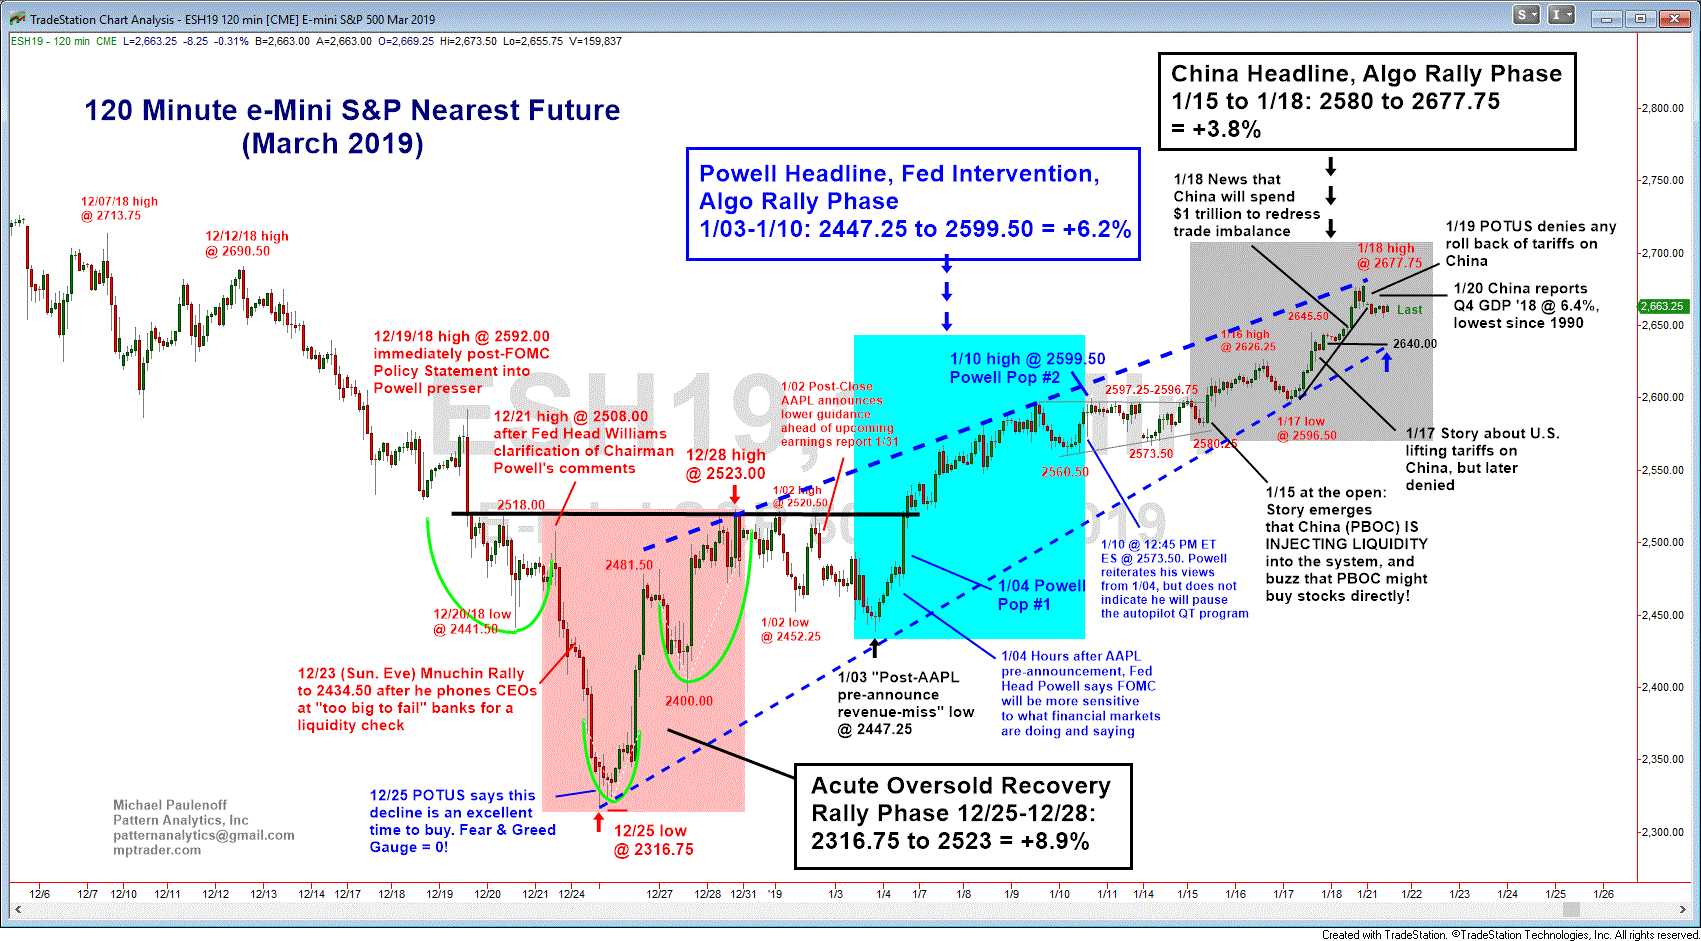
Increasingly, my view of all of the action in ES (e-mini March S&P futures contract) from the Dec 25 electronic Christmas Day low at 2316.75 into last Friday’s (Jan 18) high at 2677.75 (+15.6%) represents three distinct psychological phases of market influence, which I have color-coded on this chart:

1) Natural Acute Oversold Market Recovery Rally (highlighted in red),...MORE
2) Fed Rate Pause (Algorithmic Headline) Rally (coded in turquoise), and
3) China Stimulus, Positive Trade News (Algorithmic Headline) Rally (noted in blue).
Phase 1: Acute Oversold Recovery Rally
The initial sharp recovery rally after Christmas Day coincided with a Fear and Greed Gauge reading of 0, and a Daily Sentiment Index (DSI) of 6. The sharpness of the vertical upmove from the Dec 25 low of 2316.75 into the Dec 28 high of 2523.00 (8.9%) in my experience represents a classic short covering, counter-trend rally that returns the price structure to the area of its most recent breakdown plateau, 2520-2550.
The initial recovery phase off of an acute oversold condition was NOT precipitated by or associated with outside market influences. Indeed, at the end of December, the economic and geopolitical news was getting progressively more negative, while the Fed was silent, having hiked rates on December 19, intent on raising rates 3 to 4 more times during 2019!
Phase 2: Fed Intervention Rally
The second phase of recovery off of the Christmas Day low at 2316.75 commenced on January 4, just a few hours after Apple Inc. (APPL) pre-announced a big revenue shortfall for Q4. Imagine that on the first trading session of 2019 (Jan 3) Apple decided to drop a weak earnings bombshell on investors who already endured a 20%, three-month stock market beating!...
Alternatively, just get in your time machine go back to yesterday morning, dash off a note to Santa saying thank you but the time had come to put the gifts back in the box and await events:
Equities: Dear Santa,