It was sure feeling like that on Thursday afternoon April 29, when, after the earnings report Amazon in a burst of enthusiasm traded up to $3667.66, and did nothing but hit bids for the next two hours. And then again premarket on Friday the 30th when we posted "Amazon Crushes Earnings Estimates, Stock Does Not Act At All Well (AMZN)" with the stock 'only' up $80.59 (+2.32%) at $3551.90; already off $115.76 from the print the afternoon before and on its way to actually closing down $3.89 at $3,467.42.
AMZN is up nine bucks in today's pre-market but this action is not-at-all what longs, or the wider market, want to see.
And from StockCharts, May 1, the headline story:
....Historical Performance
I wrote an article not that long ago that discussed the performance of the S&P 500 during the first half of calendar quarters vs. the second half. Since 1950, the S&P 500's annualized returns for the 2nd calendar quarter (April 1 - June 30), broken down by halves, are as follows:
- April 1 - May 15: +14.48%
- May 16 - June 30: +1.70%
We're two weeks away from turning the page to the second half of this calendar quarter. It's fairly obvious to me that our major indices tend to move higher throughout earnings season, but tend to struggle once the majority of earnings have been released.
Earnings Reactions
At EarningsBeats.com, we're monitoring the market's reaction to thousands of earnings reports this quarter. Here's a recap, highlighting earnings reactions by sectors thus far this quarter:
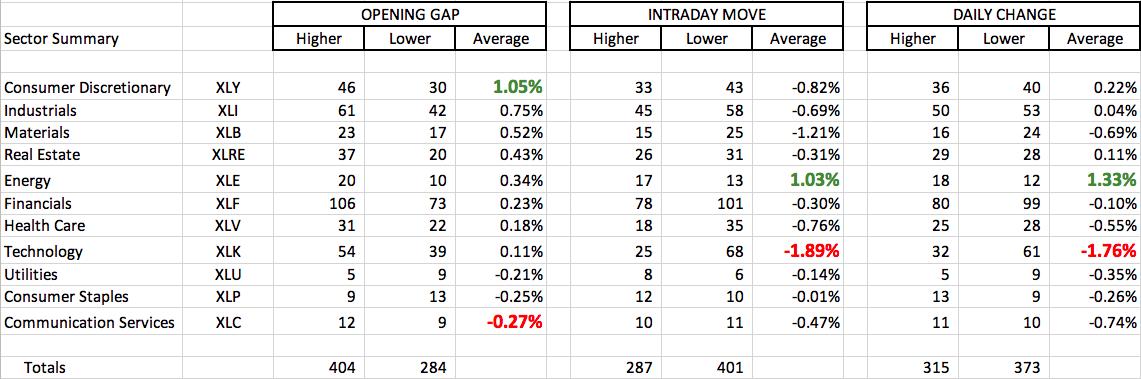
To provide an example of how to read this, let's consider consumer discretionary. 76 companies in this sector have reported earnings. The first three columns relate to the opening bell and the gap higher or lower. 46 of these 76 companies have seen their stock price gap higher, while 30 have gapped lower. The average gap has been higher by 1.05%. The next three columns relate to intraday action (opening price to closing price). Here, consumer discretionary companies haven't fared so well. Only 33 of 76 companies have move higher from the opening gap to the closing bell. 43 have moved lower. The average intraday move is -0.82%. The final three columns simply relate to the daily change - the closing price the day before the earnings are released to the closing price the day after the earnings are released.
If you've sensed that many technology companies are struggling after releasing their earnings reports, you'd be correct. The average technology stock has lost 1.89% during the trading day after earnings were released. This compares to an average opening gain of +0.11%. Once that opening bell rings, however, technology stocks have been met by swarms of sellers. That's a concern.....
....MUCH MORE