The Drought Monitor project at the University of Nebraska - Lincoln was having website issues last week so we weren't able to timely link to the maps. And although they were eventually able to get the maps for the period ended May 11 onto the site UN-L says they are still having technical difficulties.
Which gives us the opportunity to show off the Palmer Drought Indices maintained by NOAA and which we have found to be very useful when looking at drought's effects on agriculture.
One quick note: these maps are not as satisfying for panic-mongers because: 1) the time-scale is monthly rather than weekly and 2) areas with an abundance of moisture are shown in green rather than the neutral/white of the University of Nebraska maps
From NOAA's National Centers For Environmental Information:
Overview
Palmer Z Index: measures short-term drought on a monthly scale.
Palmer Drought Severity Index: attempts to measure the duration and intensity of the long-term drought-inducing circulation patterns. Long-term drought is cumulative, so the intensity of drought during the current month is dependent on the current weather patterns plus the cumulative patterns of previous months. Since weather patterns can change almost literally overnight from a long-term drought pattern to a long-term wet pattern, the PDSI can respond fairly rapidly.
Palmer Modified Drought Index: Operational version of the PDSI. Description available in Heddinghaus and Sabol (1991).
Palmer Hydrological Drought Index: measures hydrological impacts of drought (e.g., reservoir levels, groundwater levels, etc.) which take longer to develop and longer to recover from. This long-term drought index was developed to quantify these hydrological effects, and it responds more slowly to changing conditions than the PDSI....MUCH MORE (site links, references)
And among the map display choices:
Maps
Monthly maps of drought conditions in the contiguous U.S. as measured by the Palmer Drought Severity Index, Palmer Hydrological Drought Index, Palmer Modified Drought Index, and Palmer Z-Index (Palmer, 1965) are provided for January 1900—April 2021. Animations of any set of monthly maps for any period desired can be viewed by selecting the beginning and ending dates of interest.
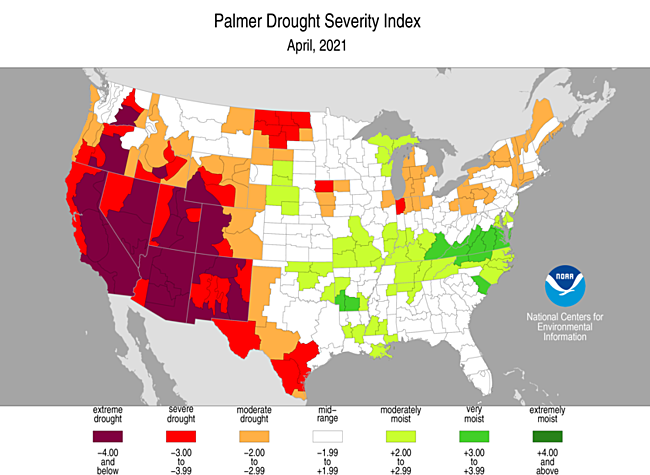
That's from the last year of monthly PDSI, a very handy presentation for blasting a large amout of information straight into your optic nerves. Animation