"AAPL: Another Parabolic Breakdown"
We don't comment on Apple all that often and when we do it's usually because it's a component
of the three major U.S. indexes.
That said, this is an interesting graphic.
From StockCharts, November 5:
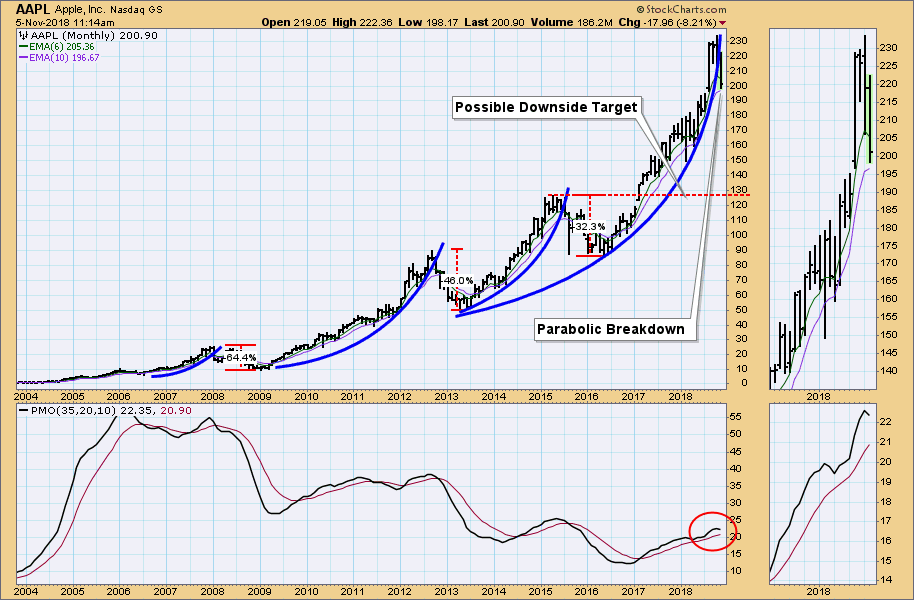
Apple, Inc. (AAPL) is nothing if not repetitive. AAPL experiences frenzied, parabolic advances that are followed by equally dramatic corrections. This has happened no less than three times in the last 11 years with an average correction of -48%. Now it appears to be happening again, as price has recently broken down through the most recent parabolic arc. To me the most obvious downside target is about 127, a decline of about -45%. As a technical target it looks reasonable, and it falls in line with the magnitude of previous corrections.
...MOREAt a recent $143.80, down $14.12 (-8.94%) he was definitely right back then that the stock had further to fall and if that 2015 peak becomes the new floor the stock still has room to drop ~10% or so from here.
Down $5.89 (-2.84%) to $201.59 today.
The damn thing almost achieved escape velocity. Maybe next time.