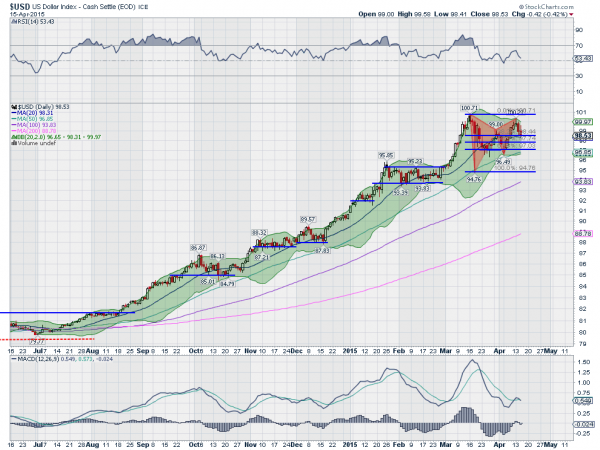
The cash dollar index is down a bit more, 97.40 versus 97.52 when the above was posted.
From Dragonfly Capital:
The US Dollar strength has been a major focal point in the financial markets. Since it took off in July the Dollar Index has risen 25%. That will get some attention. No matter if it is caused by weak global currencies or strength at home. With the consolidation since it peaked over 100 in March, many are wondering if the strength is over. Only time will tell. But there are some interesting clues playing out in the chart of the price action.
The chart below shows that rise. A very orderly stair step fashion. That is until it hit 100.71 in early March. Since then it has been a broad messy consolidation with a bizarre intraday sell off two days after the peak. But on close inspection that mess reveals itself as a harmonic pattern. And that spike down is significant. The 2 triangles outline the ‘W’ shape of a bearish harmonic Bat. That pattern completed Monday with a touch at the 88.6% retracement of the initial downward leg on the spike.
The reversal has now met its first target at 98.44, a 38.2% retracement of the entire pattern. It can easily reverse higher here or continue to the next target at 97.03, a 61.8% retracement. Either one would show continued strength and have no impact on the uptrend from July....MORE
