But that was before today's big reversal in the U.S. markets,
From See It Market:
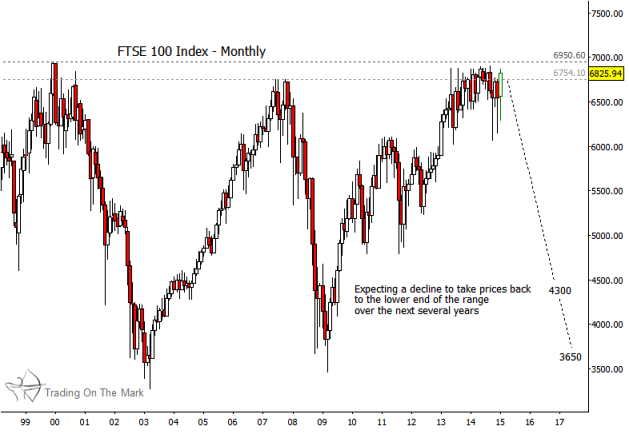
With London’s FTSE 100 Index, the current price area has stood as particularly durable resistance for more than a decade. We are watching to see whether the index can leave a lower high at the start of 2015.
The FTSE includes the top 100 stocks on the London Stock Exchange based on market capitalization. Together, the 100 companies represent more than 80% of the market capitalization of the entire exchange. Thus it has a role similar to those of the S&P 500 Index.
Market bulls have been unable to push the index above the two sets of prior highs — the most recent in 2007 at 6754.10 and the all-time high in late 1999. If the resistance area holds again, the index could start a new retracement process that lasts several months or even persists for years, taking price back to the lower edge of the 15-year range.
FTSE 100 Index Monthly Chart
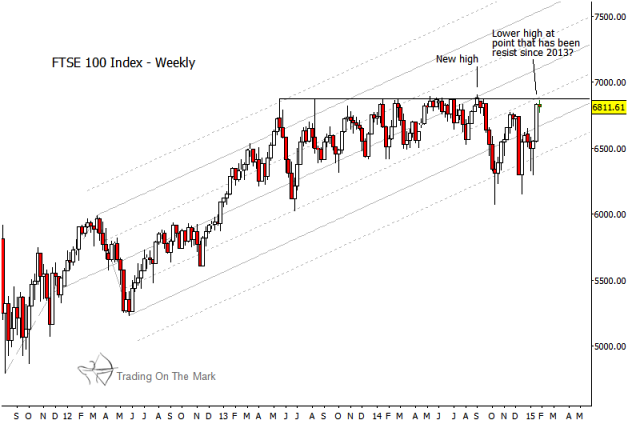
The weekly chart below shows how frequently the index has probed the resistance line during the last two years. Also, since last autumn, price has spent a considerable amount of time below the lower boundary of the weekly channel. This is not something one should see if there is still much appetite for buying.
FTSE 100 Index Weekly Chart
The silver lining of a downward forecast is that a retest of the lower price areas around 4,300 or 3,650 could become the platform from which another advance is built — one lasting several years or even a decade....MORE