This is the new Line of Death.
From Dragonfly Capital:
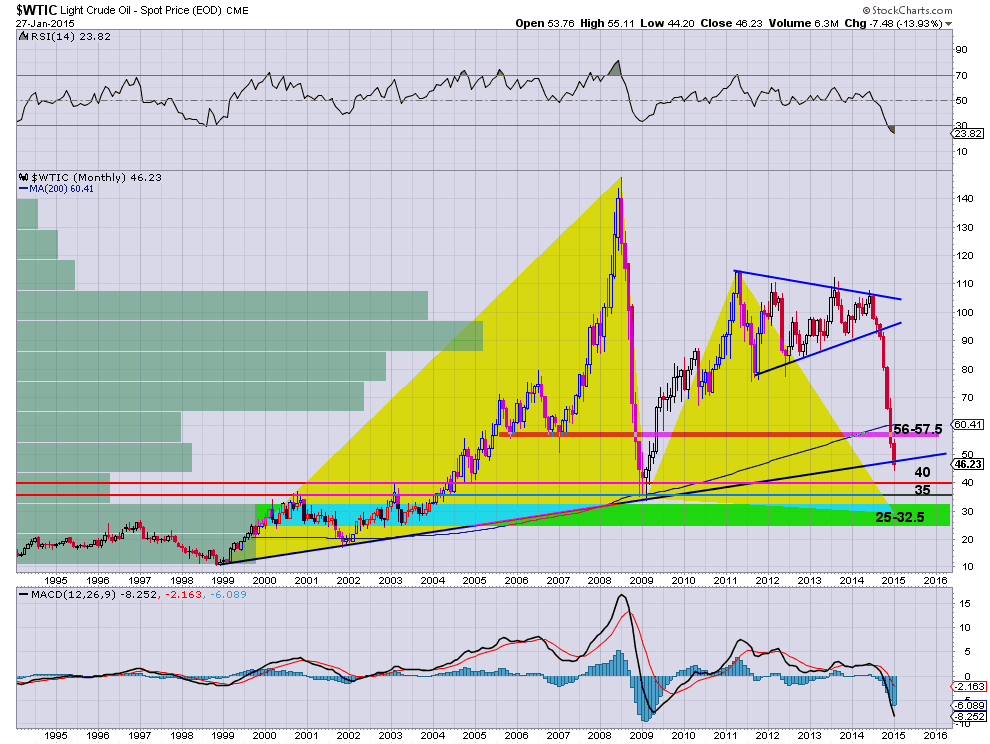
The Longer Outlook in ….. Crude Oil
Crude Oil had a log flume like ride lower over the last 7 months. Except that the water at teh bottom has not splashed yet. This has many experts talking about the sustainable price of drilling via fracking and oil sands, as well as the break even cost for many Middle Eastern countries. There are discussions about how the drop is somewhat intentional to stick to Putin and Russia, or how the Saudi’s are trying to reassert themselves on the global energy scene following the US becoming energy independent. Lot of talk. And with every move lower in the black liquid come lower price targets from those same professionals and analysts. Nothing new here.
But for technical analysts talk is cheap. Oh, now all the narratives out there can have some value, but stories do not come with a timestamp and price move. The actual price data has a whole lot more to offer and then chart of Crude Oil below has a lot to say.

The first thing that stands out in this chart is the weighted volume at price bars on the left hand side. There was a lot of price history to work through between 85 and 105, and then still large history all the way down to 65/barrel. But since then the price history has hit a pot hole and that pot hole gets deeper until the price reaches 32.50/barrel.
The second thing to notice is that the price has broken the rising 16 year price trend support line, and unless it rises back over 48/barrel by month end (3 trading days as I write, I will revise this section Saturday) will close under it. That would be a major breakdown....MORE