That is so 2009.
From John Authers at the Financial Times:
Active managers rally to strike against drones
For five years, the story for investment managers has been of The Triumph of the Drones. Passive investment managers have dominated sales, far outstripping active asset managers. Exchange traded funds, still overwhelmingly passive vehicles, have made life even harder for active managers.
Meanwhile, active managers – whether working for regulated groups or for hedge funds – have not helped their cause by failing to beat their benchmark indices. Small wonder investors balk at paying their management fees. But now, active managers believe, it is time for the Revenge of the Stockpickers.The excuse has been plain. The panic that followed the Lehman bankruptcy made everything fall at once. No chance to outperform there. But since then, the recovery has been wary, following a pattern of “risk on-risk off”. When macro conditions seem less alarming, risk assets rise together. When the global situation looks more threatening, generally because of political developments in the US or the eurozone, everything falls together....MORE
...Correlation is measured in various ways, but the picture is consistent. Andrew Goldberg of JPMorgan Asset Management in London, points to research going back to 1926 which tracks the correlation of every large-cap stock with every other. It tracks a dauntingly large series of pairs.
The average over this entire period was 0.269. In other words, differences in the performance of one stock are sufficient to explain 26.9 per cent of the difference in the performance of any other stock. This measure reached 0.63 in the quarter after Lehman. The latest measure is just over 0.36, and it has been as low as 0.32....
And from The Short Side of Long:
...Chart 1: One year performance shows western equities leading the gains
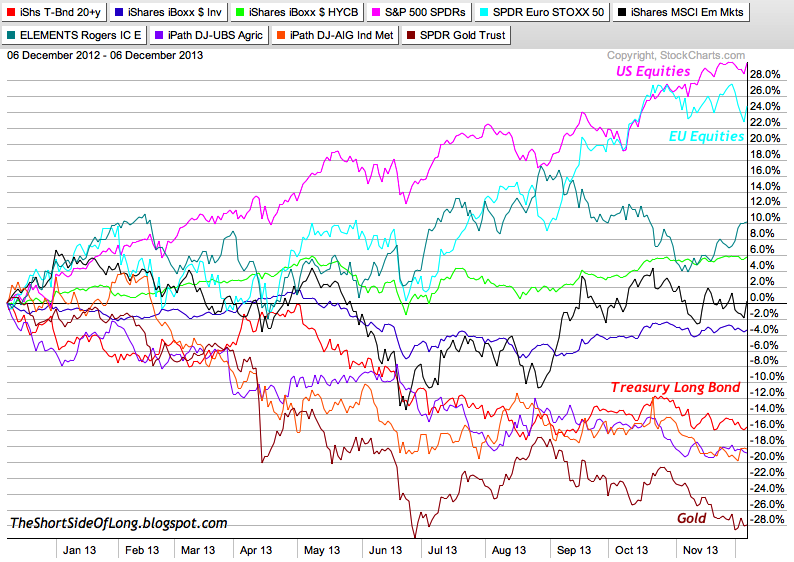
Source: Stock Charts (edited by Short Side of Long)
Today I will cover major global macro assets, both based on nominal and relative performance over 1, 3 and 5 year time frames. So... let us start with the last 12 months.
2013 has been the year of western equity outperformance. Plain and simple - whether it was US, EU or in particular Japan (not on the chart above), this is just about the only asst class that worked and worked well. Energy held its own, mainly due to Brent Crude contract and recovery in Natural Gas, while Junk Bonds did decently as well.
...MUCH MORE