From Greenbackd:
On The Great Shiller PE Controversy: Are Cyclically-Adjusted Earnings Below The Long-Term Trend?
AQR’s Cliff Asness released in November last year a great piece called, “An Old Friend: The Stock Market’s Shiller P/E (.pdf)” dealing with some of the “current controversy” around the Shiller PE, most notably that the real earnings used in the Shiller PE are lower than they would otherwise be because of two serious earnings recessions: the tail end of the 2000-2002 recession, and the monster 2008 financial crisis.
The Shiller P/E represents what an investor pays for the last 10 years’ average real S&P 500 earnings. The ten-year average is believed to be a more stable measure than a P/E based on a single year of earnings, and therefore more predictive of long-term future stock returns and earnings. Asness notes that the selection of a ten-year average is arbitrary (“You would be hard-pressed to find a theoretical argument favoring it over, say, nine or 12 years”), but believes that it is “reasonable and intuitive.”
Asness asks, “[W]hy do some people dismiss today’s high Shiller P/E, saying it’s not a problem? Why do they forecast much higher long-term real stock returns than implied by the Shiller P/E?”:
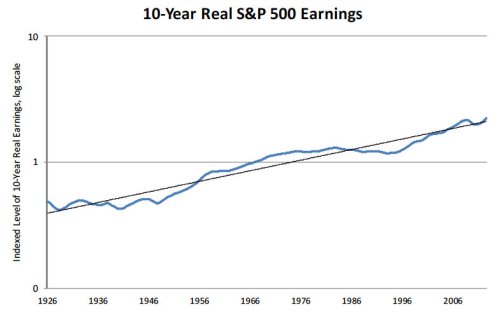
They point out that we had two serious earnings recessions recently (though only the tail end of the 2000-2002 event makes it into today’s Shiller P/E), including one that was a doozy following the 2008 financial crisis.Asness shows the following chart of a rolling average of 10-year real S&P 500 earnings (a backwards looking 10-year average):
…
So we have to ask ourselves, is the argument against using the Shiller P/E today right? Are the past 10 years of real earnings too low to be meaningful going forward (meaning the current Shiller P/E is biased too high)?
The chart demonstrates that 10-year real earnings used in the Shiller P/E are currently slightly above their long-term trend. At their low after the financial crisis, they fell back to approximately long-term trend. Asness comments:
It has not, in fact, been a bad prior decade for real earnings! The core argument of today’s Shiller P/E critics is just wrong....MORE
