From New Geography:
Population change has short run and long run effects. Short run effects include changes in fertility rates that can result from economic fluctuations. For example, during a recession, couples may delay having children until economic conditions improve. Once job growth has begun and expectations rise, birthrates can increase The correlation is not perfect and other demographic factors could come into play.
Yet it seems increasingly true that for a rapidly increasing portion of the American landscape, deaths will routinely exceed births. Indeed, total births in the USA peaked at 4,316,000 in 2007, before dropping in the last four years. Recently released provisional birth data by the CDC (Center for Disease Control) show that births in 2011 are preliminarily estimated to be 3,961,000, the lowest figure since 1999. Reviewing the data month by month, we seem to be experiencing continued downward momentum this year. With deaths hitting an all time high of 2,507,000 in 2011, the natural rate of increase for 2011 looks to have dropped to .0047 percent (slightly less than half a percent per year).
With the expectation that the world’s population will stabilize mid-century, eventually every country’s population – with few exceptions in Africa and elsewhere – will stop increasing. Deaths will exceed births in most countries, and future growth may become more a function of shifting migration patterns.
This reality can already be seen in parts of the United States. In one third of the 3,141 counties deaths now exceed births. In the next nine years, the number of counties in this category will expand, which could result in a markedly lower population count in the 2020 census. In contrast, a number of counties continue to experience significant natural rate of increase, and a handful of places experience the triad of dynamic change: births exceeding deaths, immigration, and positive net migration from other parts of the USA.
The Census recently released population estimates for America’s 3,141 counties. We can compare the estimates of July 1, 2011 with those of July 1, 2010, by visualizing a series of maps.
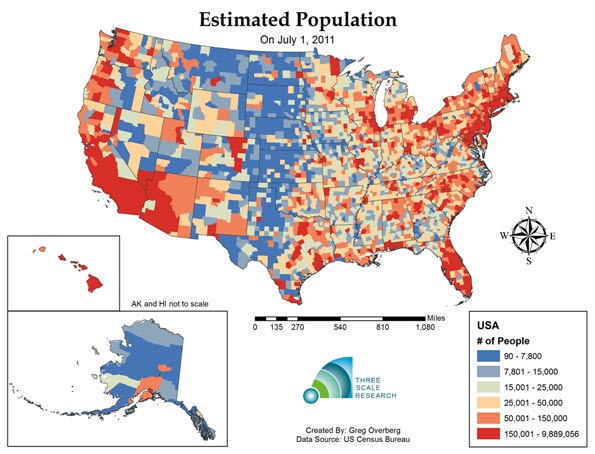
Map Figure One: Estimated Population by County as of July 1, 2011
The first map shows the distribution of population by county: revealing concentrations in the coastal areas, and lower population in the central regions. Los Angeles County, California had the most persons:9,889,056 persons; Kalawao County, Hawaii had the fewest: 90 persons.
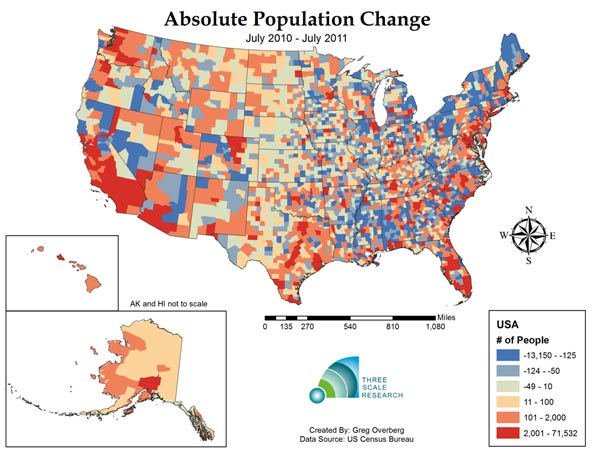
Map Figure Two: Estimated Absolute Change in Population from July 1, 2010 to July 1, 2011
The second map shows the pattern of population change during one year. A total of 1,494 counties lost population, or about 47% of America’s 3,143 counties. This number is an increase from the change from 2000-2010, where 1,103 counties lost population. As one third of counties are experiencing greater deaths than births, another twelve percent are experiencing losses due to net migration. The county that gained the most people from 2010 to 2011 was Harris County, Texas (Houston), which added 71,532 persons. The county that lost the most people was Wayne County, Michigan (Detroit), with a decline of 13,150 persons.
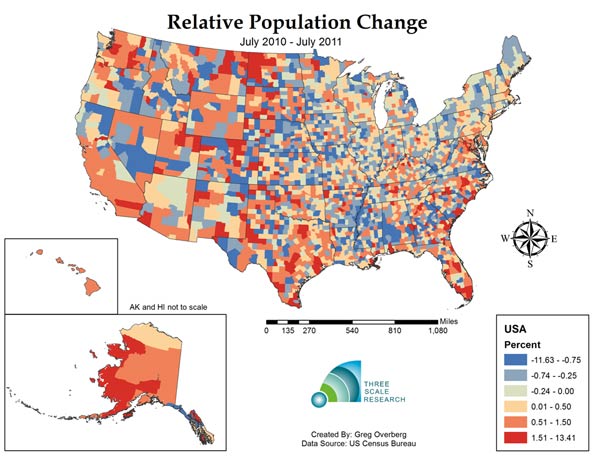
Map Figure Three: Estimated Relative Change in Population from July 1, 2010 to July 1, 2011
The third map shows relative population change in the United States. This reveals quite a varied landscape. Western North Dakota, experiencing rapid growth of its energy sector, is experiencing fast population growth, along with metropolitan counties in Texas, Colorado, North Carolina and Florida. The county with the fastest population growth is Loving County, Texas, in the rural and isolated West Texas panhandle, with a 13.25% growth rate resulting from the population increasing from 83 to 94 persons....MUCH MORE
*A twelve year old story I happened to remember:
The Axis Powers Are Aging
Germany, Italy and Japan are once again preparing to lead the world. This time, however, there is no need for concern. Why? Because they're going to lead the world in getting old.For a first-class bit of information visualization check out GE's "Our Aging World".
It appears that Japan, Italy and Germany — in that order — sit atop the list of countries ranked by how rapidly their populations are aging. Recent research by Merrill Lynch suggests that between 20% and 22% of these countries populations will be 65 years of age or older within just ten year's time.
Those with a keen sense of history will recognize Japan, Germany and Italy as the Axis Powers of World War II. Interestingly, none of those countries' wartime leaders ever actually made it into the 65-and-over age group....